This is the first in a series of blog posts on racial and gender disparities in income volatility. Please check back regularly for future installments, which will include interviews with scholars and reactions to this post.
Racial inequality is an undeniable, distressing feature of America’s economy. In both income and wealth, Hispanic and African American households are far behind non-Hispanic white and Asian households. Median white household income is almost $20,000 higher than Hispanic income, and nearly $25,000 higher than African American income. Wealth disparities are even more vast; the median wealth of white families was over $100,000 higher than the median wealth of both African American and Hispanic families in 2011.
However, there is another type of inequality that has barely been explored – inequality of income volatility. Researchers in the field of financial security have begun to recognize that it is not just the amount of income, but also the ups and downs of income, that affect financial well-being. In the past several years, academics, government, and think-tanks alike have conducted research examining the sources, prevalence, and implications of income volatility. Indeed, the confluence of actors beginning to work on the issue is one reason EPIC chose volatility as its first focus area. But despite the recent proliferation of research, we still do not know a lot about the relationship between income volatility and race or ethnicity. This is concerning because income volatility can have negative consequences on families’ financial and physical health, and racial disparities in wealth, health, and access to financial services could exacerbate these consequences.
In order to get a closer look at the relationship between income volatility and race, I conducted a quantitative analysis of the Survey of Income and Program Participation (SIPP).[1] My goal was to find out whether people of color experienced greater rates of income volatility and, if so, find potential sources for volatility disparities. For this study, I measured volatility as a monthly percentage change from a two-year average income.[2]
Simply comparing rates of income volatility between different racial and ethnic groups without controlling for other variables reveals a small but statistically significant racial volatility gap (see table below). The gap between non-Hispanic white and Hispanic individuals is the highest, a little over a 5% difference, with Asians and members of the Other race category close behind.[3] It is worth noting that all non-white categories have above-average income volatility when compared to the sample as a whole. However, racial differences in volatility are small when compared to other key characteristics like income, work hours, and employment status. These findings are similar to those from previous studies of the SIPP (see the “Faces of Volatility” infographic), which found a statistically significant racial volatility gap but an even larger gap between income groups.[4]
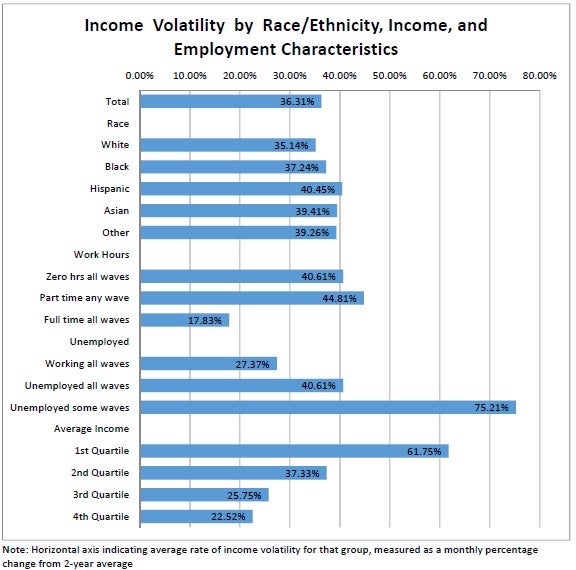
Looking at these other determinants of volatility, we find some potential sources of the racial volatility gap. Part of the story is that African Americans, Hispanics, and individuals in the Other race category have lower incomes and lower rates of full-time work compared to white and Asian individuals (see table below).
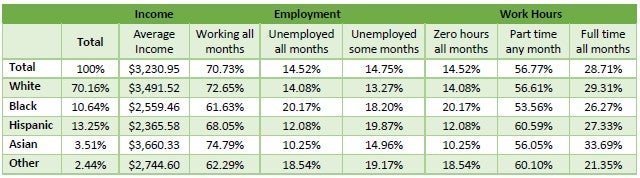
These findings suggest that the racial volatility gap reflects broader structural discrimination in the labor market. Although variable schedules and other labor market drivers of volatility affect workers of all races, African American and Hispanic workers are over-represented in the low-wage service sector, much more likely to be unemployed, and less likely to have control over their work schedules compared to white workers. For Asian individuals, the racial volatility gap might be due to higher volatility of informal sources of income, such as savings groups or boarders, especially for immigrants who lack access to formal financial institutions.[5]
The racial volatility gap has important implications for the volatility solutions agenda. Because people of color experience greater income volatility, solutions to income volatility must be inclusive. We cannot assume that all low-income people experience income volatility the same way, or have access to the same financial institutions, financial products, employment options, or social networks. Additionally, more research is needed on the connection between race and income volatility to better understand causes of the gap and move closer to a consensus on this issue.
Judith Garber is a recent graduate of the Heller School for Social Policy and Management at Brandeis University and a former intern with the Financial Security Program at The Aspen Institute. Her original research on income volatility and race was conducted as part of her Master’s program and can be read in here.
[1] For more on the Survey of Income and Program Participation, see http://www.census.gov/sipp/.
[2] The coefficient of variation is the ratio of the standard deviation of income divided by average income. It is a common measurement of income volatility (Bania & Leete, (2009), “Monthly Household Income Volatility in the United States, 1991/1992 vs 2002/2003; Hannagan & Morduch (2015), “Income Gains and Month-to-Month Income Volatility: Evidence from the US Financial Diaries”). For this analysis, I excluded observations with negative or zero average income, and removed the top 1% highest-earning individuals and the top 5% most volatile individuals to reduce the effect of outliers, consistent with previous studies (Acs, Lopret, & Nichols (2009) “Risk and Recovery: Understanding the Changing Risks to Family Incomes”; Dahl, DeLeire, & Mok (2012) “Food Insufficiency and Income Volatility in U.S. Households: The Effects of Imputed Earnings in the SIPP”; Hannagan & Morduch, 2015).
[3] The Other race category includes Native Americans, Pacific Islanders, Alaska Natives, and anyone who marked more than one race category.
[4] In Bania & Leete (2009), “Monthly Household Income Volatility in the United States, 1991/1992 vs 2002/2003,” the authors found that Hispanic households experienced 42% more income volatility than non-Hispanic white households, and African American households experienced 14% more volatility than white households. My research finds a smaller gap, that Hispanic individuals experience 15% more volatility and African Americans experience 6% more volatility compared to whites.
[5] Morduch, J., Ogden, T., & Schneider, R. (2014). “An Invisible Finance Sector: Households Use Financial Tools of Their Own Making.” Retrieved from http://www.usfinancialdiaries.org/issue3-informal.
Back to the FSP homepage.

