
Flag football surpassed tackle as the most commonly played form of the game for kids ages 6 to 12 in 2017. Fewer kids are physically inactive. Sampling of most major team sports is up. Most coaches are still winging it. And kids from lower-income homes face increasing barriers to sports participation.
Those are among the key findings from the Aspen Institute Sports & Society Program’s State of Play: 2018 report released on October 16 at the Project Play Summit. Progress is being made in some areas; much more improvement is needed to realize the goal of every child having access to quality sports, regardless of zip code or ability.
Below is Project Play’s annual release of charts showing the national landscape in youth sports compared to past years. All data are for kids ages 6 to 12 and were provided to the Aspen Institute by the Sports & Fitness Industry Association, which in 2017 commissioned a survey of 30,999 individuals through Sports Marketing Surveys.
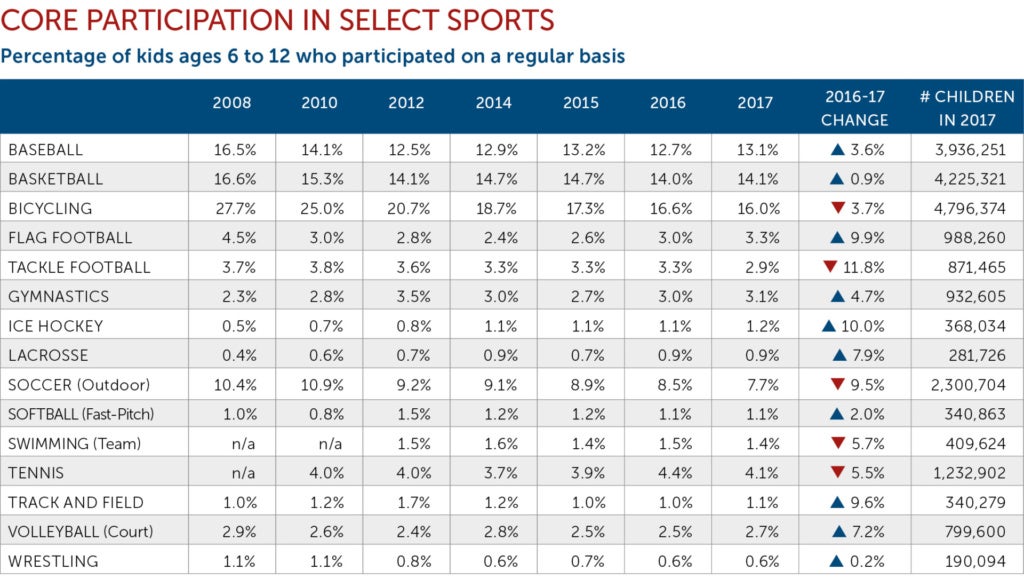
The biggest news: Flag football (3.3 percent) surpassed tackle football (2.9 percent) for kids ages 6 to 12 who played sports on a regular basis. The sports with the largest three-year participation increase were flag football (38.9 percent) and competitive cheerleading (29.8 percent). Tackle football was down almost 2 percent.
Ten of the 15 sports tracked by Project Play saw increased participation on a regular basis in 2017. That’s progress, though the big three sports for kids (soccer, baseball, and basketball) are still down significantly from a decade ago. In 2017, only bicycling, tackle football, soccer, swimming, and tennis experienced one-year declines.
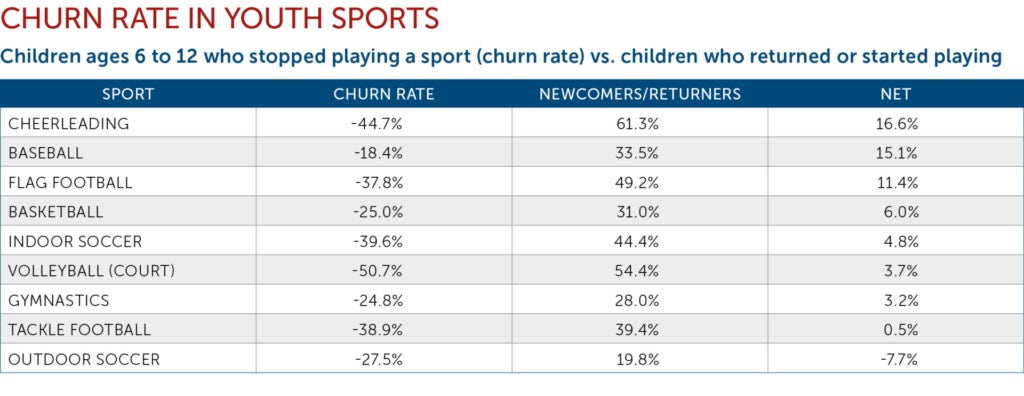
Churn rate means the difference between the number of kids a sport loses compared to the number who return or try the sport for the first time. In 2017, among the nine sports evaluated by Project Play, cheerleading, baseball, and flag football fared the best in retaining and bringing in new participants. Baseball lost the fewest percentage of kids (18.4 percent). Soccer was at the bottom of the list with a negative 7.7 percent net churn rate.
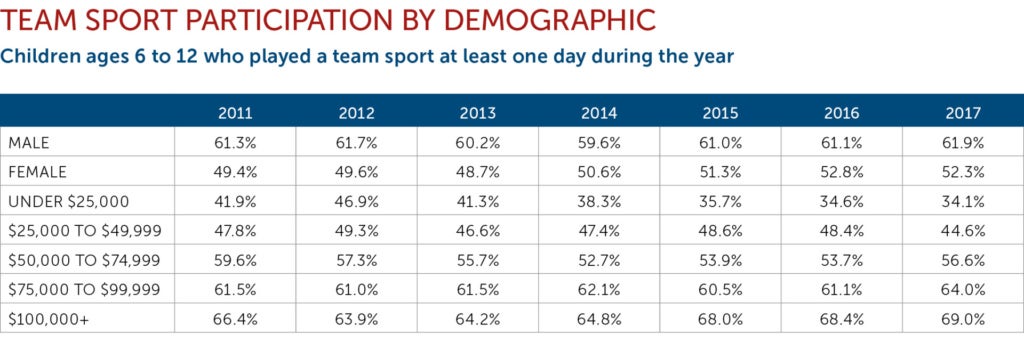
Consider this: In 2012, 46.9 percent of kids ages 6-12 in household incomes of under $25,000 played a team sport at least one day. At the time, there was very little difference in participation numbers between those children and kids in homes with incomes of $25,000 to $49,000 (49.3 percent). And even the gap between the lowest- and highest-income kids was “only” 17 percentage points. By 2017, that gap had doubled to 34.9 percentage points. The kids in homes under $25,000 were now 10.5 percentage points behind just the next highest class. Poorer kids are being left behind in all aspects of society, and sports is no different.
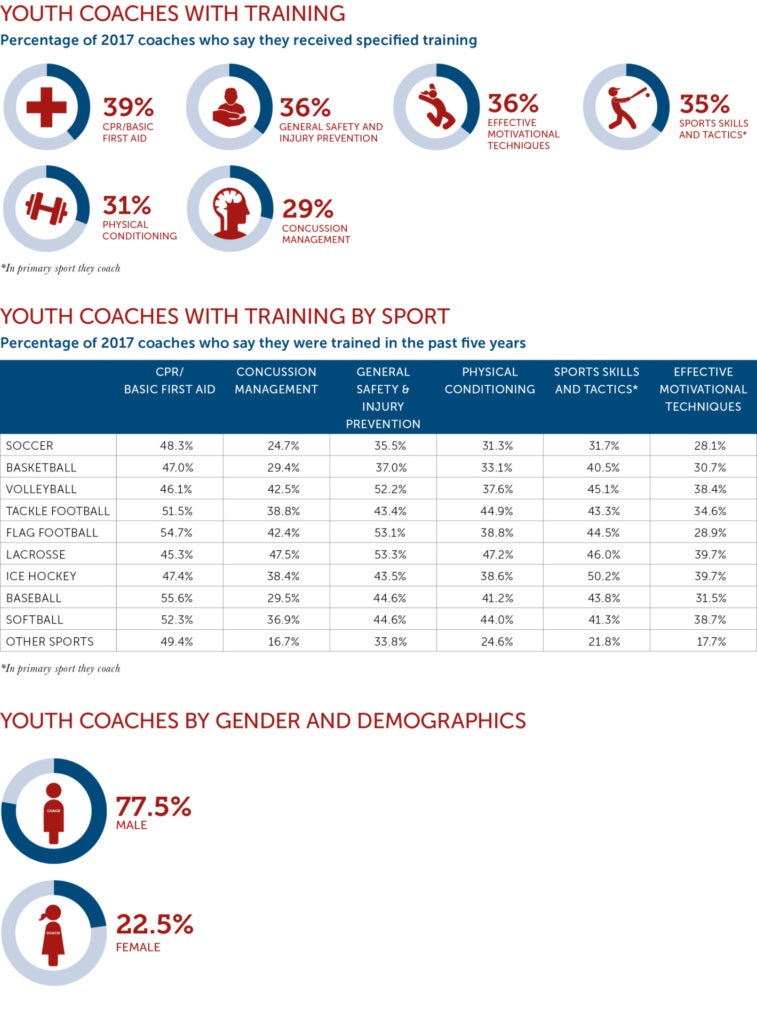
Less than four in 10 youth coaches say they are trained in any of the following areas: sport skills and tactics, effective motivational technique, or safety needs (CPR/basic first aid and concussion management). Lacrosse had the highest percentage of trained coaches in four of the six competencies; soccer was last in five categories. For the third straight year, soccer ranked last among coaches trained in concussion management (25 percent). Lacrosse was the highest (48 percent). Lacrosse, flag football, and volleyball coaches were the most trained in general safety.
Women remained an untapped area to develop more youth coaches. In 2017, only 23 percent of adults who coached kids 14 and under in the past five years were female. That was down from 28 percent in 2016 and the lowest on record dating to 2012.
Younger and older citizens also could be recruited as coaches. In 2017, 81 percent of youth coaches were between the ages of 25 and 54. Some of that is natural since that’s the period when people tend to have children playing sports. But high school and college students and retired citizens are available to help too.
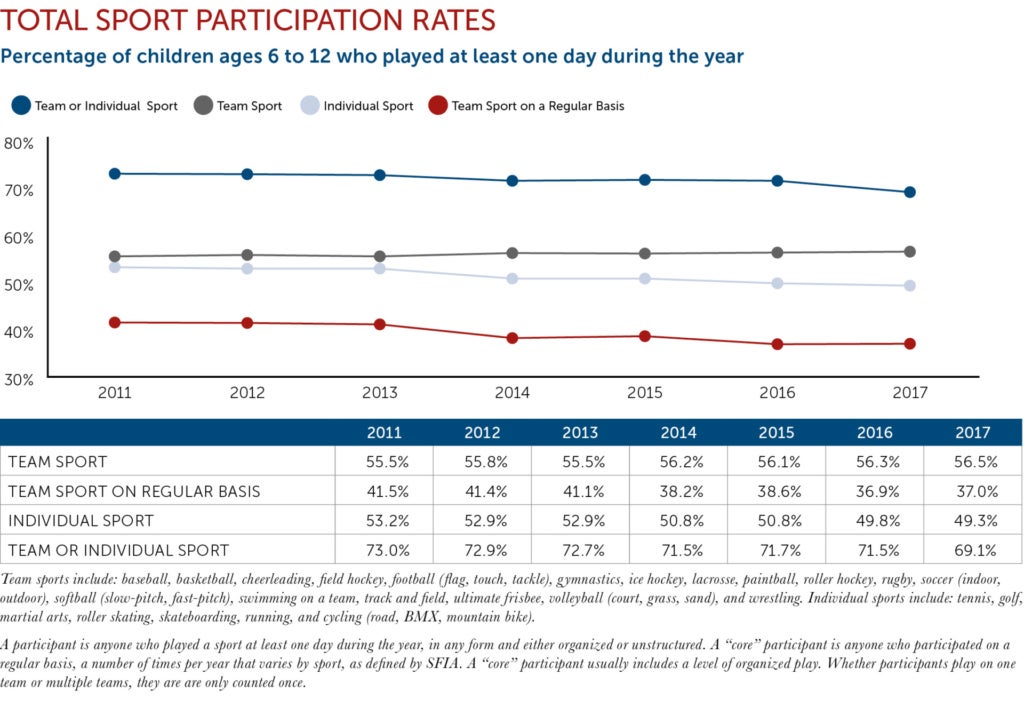
The percentage of children who played a team sport at least one day in 2017 slightly increased for the third straight year. But the percentage of kids who played team sports on a regular basis in 2017 (37 percent) remained a far cry from 2011 (41.5 percent).
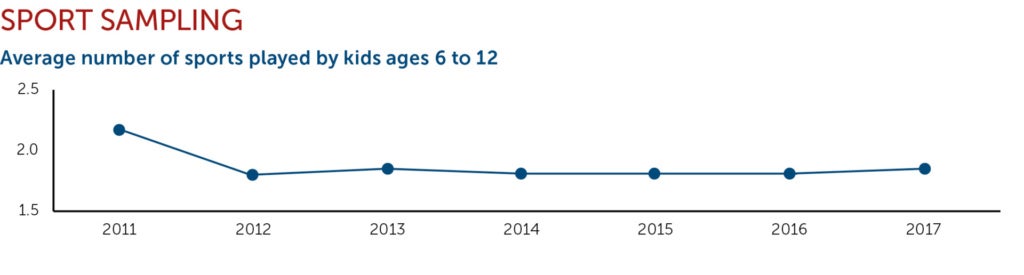
Children in our age group played an average of 1.85 team sports in 2017 – the first improvement in four years, albeit a slight increase. As recently as 2011, kids were averaging more than two sports (2.11). Still, 2017 marked progress.
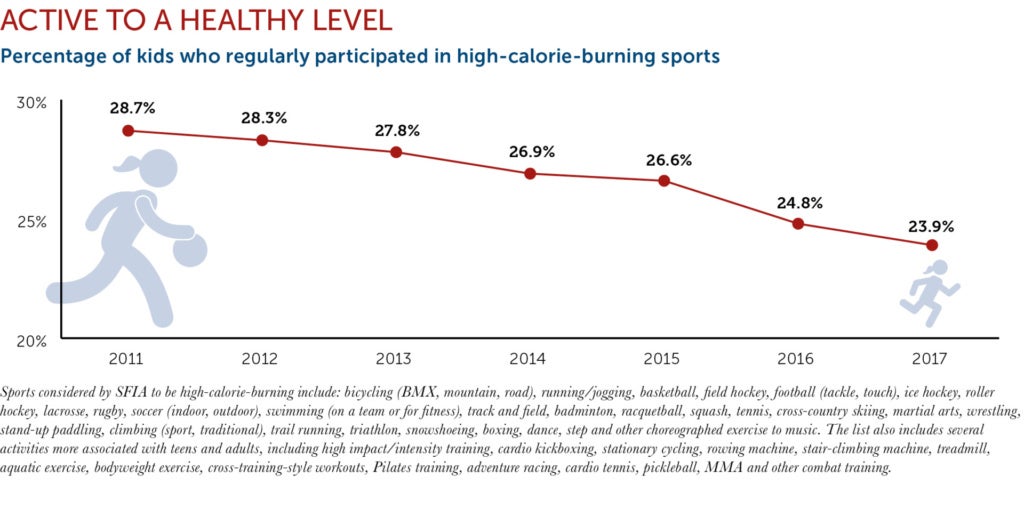
This statistic perennially shows a decline. In 2017, only 23.9 percent of kids in our age group regularly participated in high-calorie-burning sports. The figure was as high as 28.7 percent in 2011.
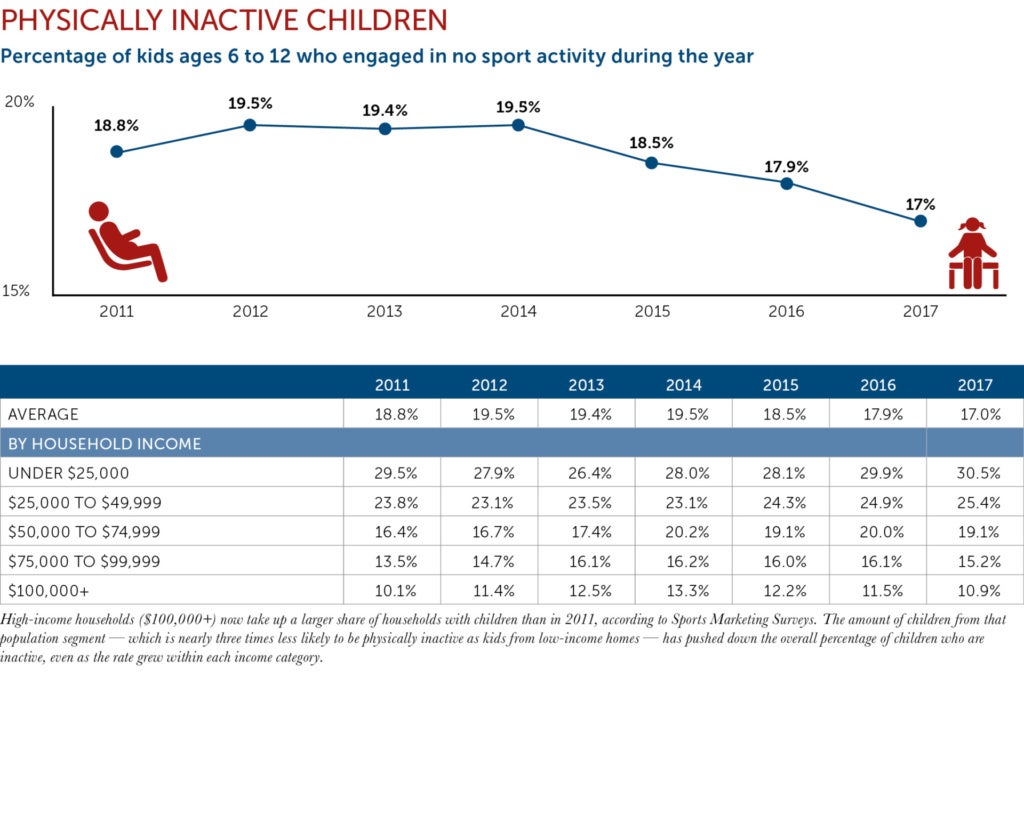
Good news: The percentage of physically inactive children has now fallen for three consecutive years, from 19.5 percent in 2014 to 17 percent in 2017. That’s still too many children not moving, but it’s a major advance. In total, roughly 700,000 more kids are now off the couch and doing something.
To learn more about Project Play, visit www.ProjectPlay.us. Read the entire State of Play: 2018 report at as.pn/Play2018. Watch videos and read companion content from the 2018 Project Play Summit. Project Play released new tools, reports and commitments to help more kids get active through sports.