Since the late 20th century, it has become harder for most households in the US to maintain financial stability, let alone rebuild their wealth after the Great Recession. At the same time, the fortunes of the wealthy have skyrocketed. By 2021, the top 10% of households by net worth owned 70% of the country’s wealth. Between 2007 and 2019, household wealth declined for all but the top 20%, despite a historic period of GDP growth. The wealth divide is further explained by differences in ownership of key assets and debts. These disparities also contribute to widening racial gaps. The charts below make it clear that the benefits of economic growth are not enjoyed by all, and that the time is now for bold solutions that enable everyone to build wealth.
Note: The charts in this piece were created by Aspen FSP using data from the Federal Reserve’s Survey of Consumer Finances and Distributional Financial Accounts.
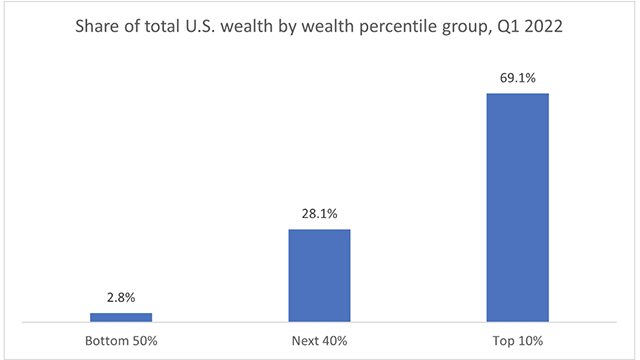
The top 10% of households by net worth hold nearly 70% of the country’s wealth
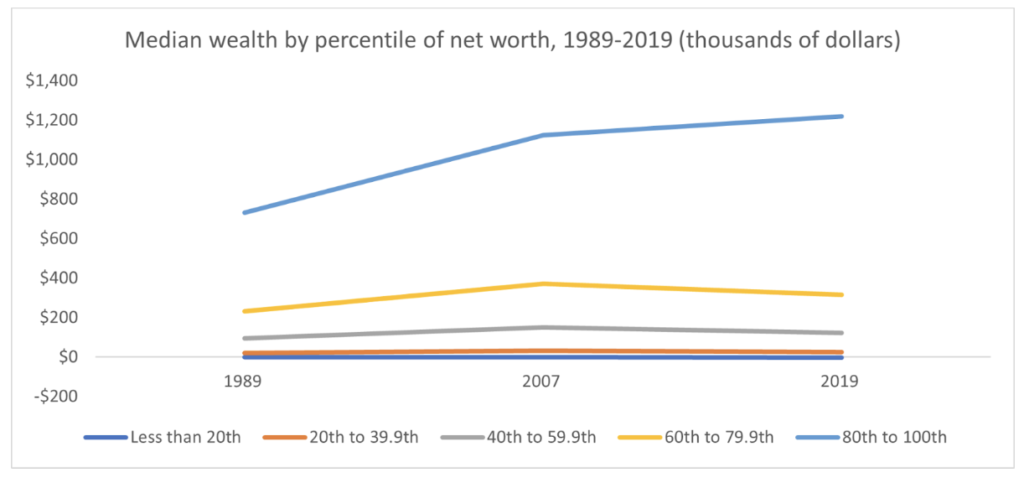
Since 2007, wealth has declined for all but the top 20%.
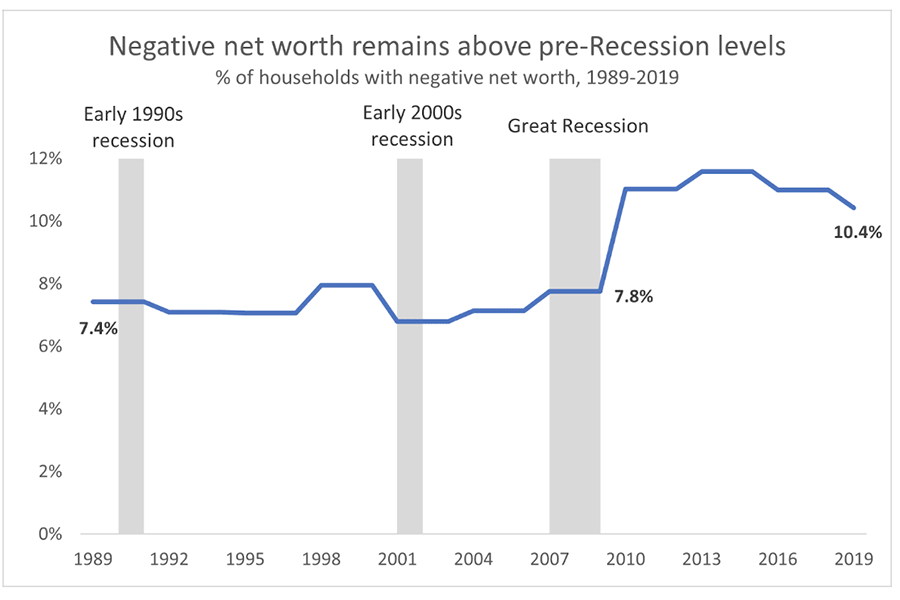
There has been a historic increase in the proportion of households with negative net worth, driven largely by student loan debt
While negative net worth stayed between 7%-8% from 1989 to 2007, it grew more sharply in the following decade, leaving 10.4% of households in the red by 2019. Student loans are the most prevalent type of debt, held by 71% of negative net worth households.
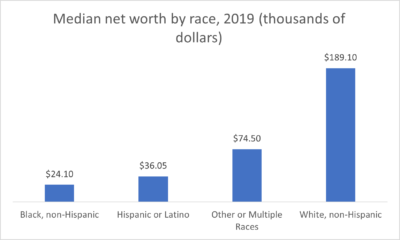
Median white household wealth far exceeds other races
The median white household has $189,100 in wealth, nearly eight times higher than the median Black household (which holds $24,100) and over five times more than the median Hispanic/Latino household (which holds $36,050).
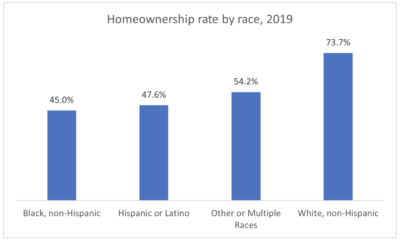
Disparities in homeownership are a major driver of the racial wealth gap
In aggregate, the median Black, Hispanic or Latino household has $0 in wealth from their home—because under 50% of each group owns homes. The median white and other or multiple race household has between $160,000 and $200,000, respectively. One driver is that the white homeownership rate exceeds those of other races by at least 20 percentage points.
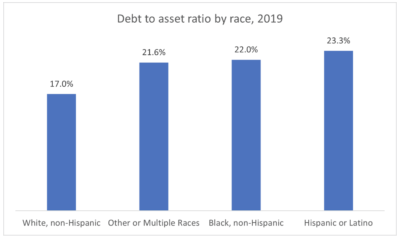
Debt eats up a larger share of assets for households of color than white households
Debt is more likely to counter the wealth gains of assets for households of color than white households.
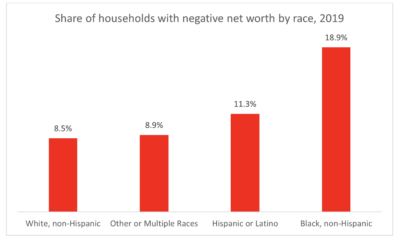
Households of color are also more likely to have negative net worth than white households.
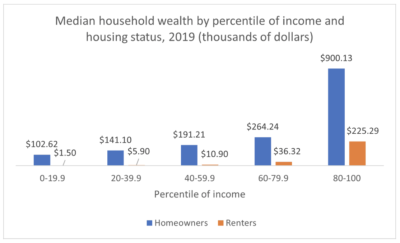
There is a major wealth divide between homeowners and renters
For every level of income, homeowners have more wealth than renters. Homeowners in the bottom 20% of the income distribution have a higher net worth than renters who earn as much as the 80th percentile of income.
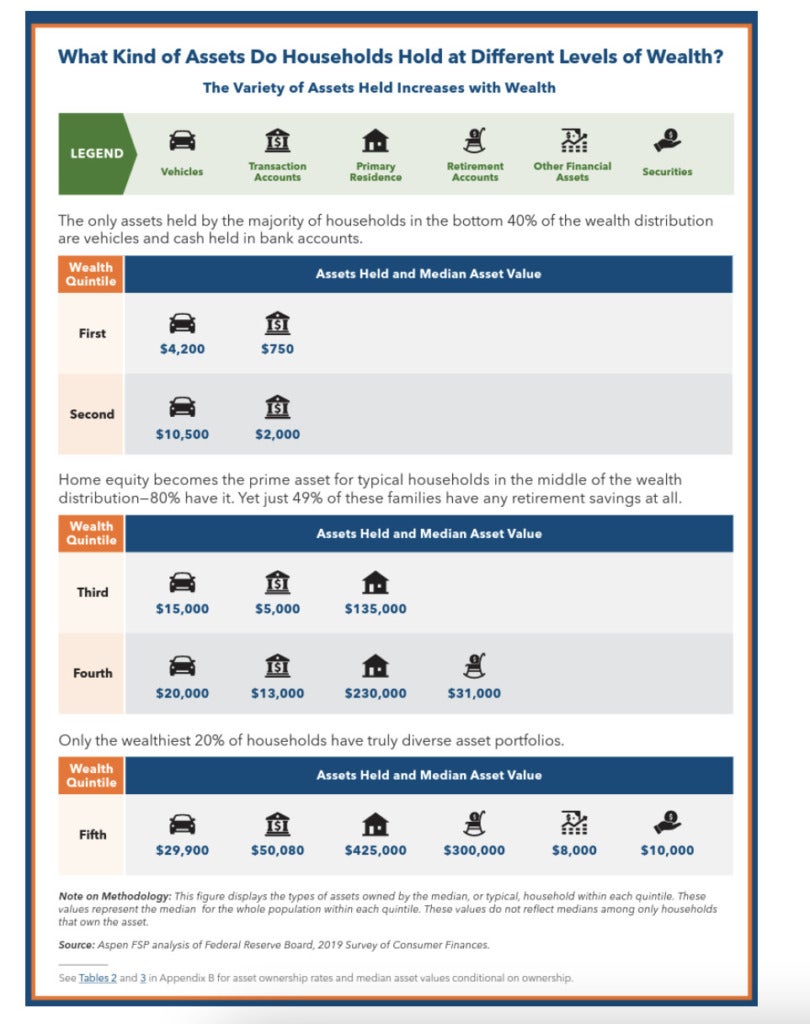
Only the wealthiest households have a diverse range of assets
The graphic below, taken from our 101 Solutions for Inclusive Wealth Building report, shows that wealthier households have a greater diversity of assets and that only households in the top 20% of net worth hold wealth-boosting assets beyond the fundamentals of transaction accounts, vehicles, housing, and retirement accounts.
In summary, the households in the bottom half of the US wealth distribution, the majority of Black and Hispanic/Latino households, and many other people of color lack the wealth they need to have financial security. These charts illustrate the magnitude of the problems. Aspen FSP’s recent report, 101 Solutions for Inclusive Wealth Building, highlights the many opportunities we have to help solve them.