In the often confusing and frustrating world of youth sports, some progress is being made. The Aspen Institute Sports & Society Program’s Project Play discovered these trends within research of kids ages 6 to 12:
- The percentage of kids playing team sports on a regular basis increased for the third consecutive year. Baseball, cheerleading, gymnastics, lacrosse, softball, swimming, tennis, volleyball and wrestling all registered positive bumps.
- Fewer kids were physically inactive for the fourth consecutive year.
- Multisport play continued to make a slight comeback.
Those are among the key findings from the Aspen Institute’s State of Play 2019 report released today on how well stakeholders served children through sports over the past year. To that end, the Project Play 2020 campaign, “Don’t Retire, Kid” campaign, raises awareness about gaps in the youth sports system that cause kids to quit sports or not start in the first place – and solutions to keep them in the game.
But major gaps remain. While regular sports participation increased to 38% in 2018, it’s still far from the level of 45% in 2008. Kids from lower-income homes are more than three times as likely to be physically inactive. Families are spending on average almost $700 per child for one sport each year, with some parents spending tens of thousands of dollars. And less than three of 10 youth coaches have been trained within the past year.
Below is Project Play’s annual release of charts showing the national landscape in youth sports compared to past years. Unless otherwise noted, all data were provided to the Aspen Institute by the Sports & Fitness Industry Association (SFIA), which in 2018 commissioned an online survey of 20,069 individuals through Sports Marketing Surveys.
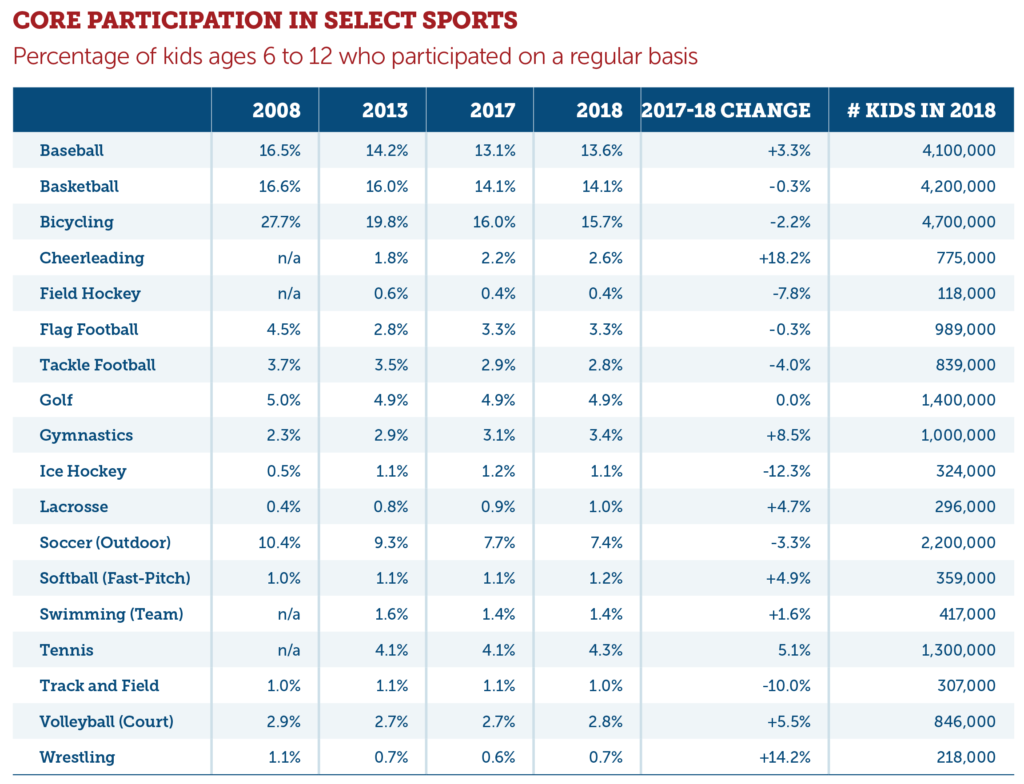
Baseball saw an increase in participation for kids, thanks in part to Major League Baseball initiatives to rejuvenate some local communities and the travel-ball culture (which carries expensive costs). Tackle football continued to decline and again remained behind flag. Soccer has lost 474,000 kids in five years. Soccer’s participation rate is now closer to that of tennis than it is to baseball’s and basketball’s.
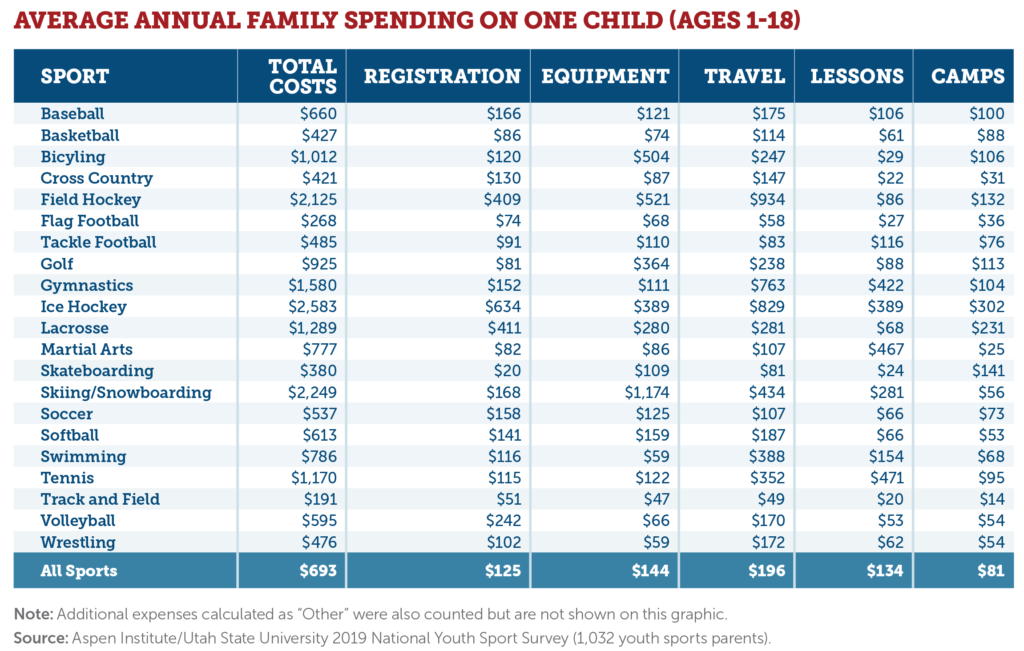
On average, a family annually spends $693 per child in one sport, according to a 2019 national survey of youth-sports parents by the Aspen Institute and Utah State University Families in Sport Lab. The most expensive sports: ice hockey ($2,583), skiing/snowboarding ($2,249), field hockey ($2,125), gymnastics ($1,580), and lacrosse ($1,289). The latest expensive: track and field ($191), flag football ($268), skateboarding ($380), cross country ($421), and basketball ($427).
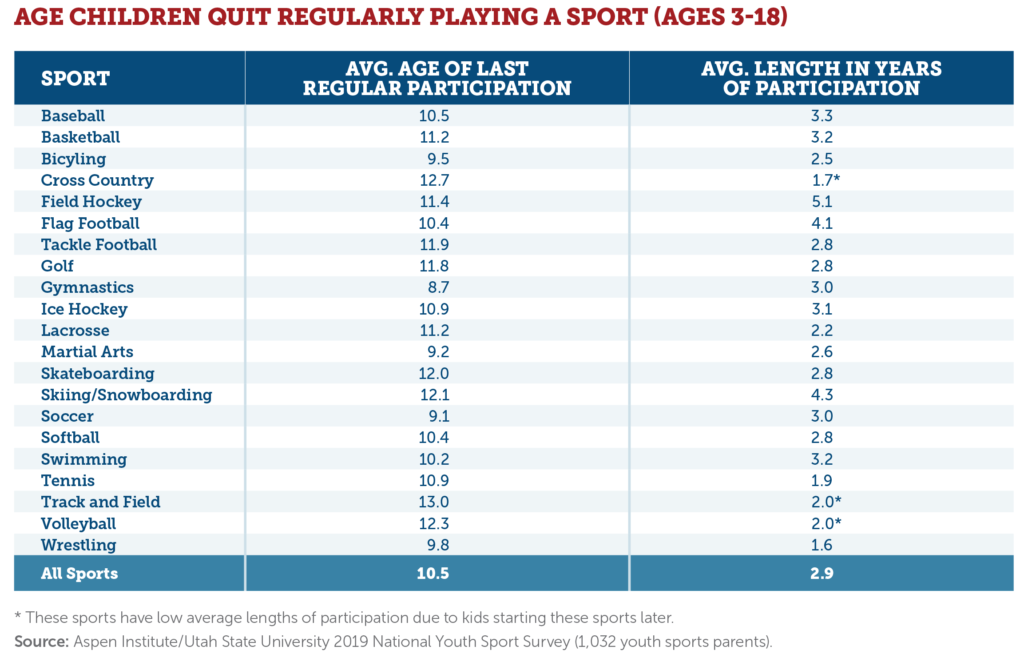
The average child today spends less than three years playing a sport and quits by age 11, most often because the sport just isn’t fun anymore, according to the Aspen Institute/Utah State parent survey. The sports with the longest shelf life: field hockey, skiing/snowboarding, and flag football.
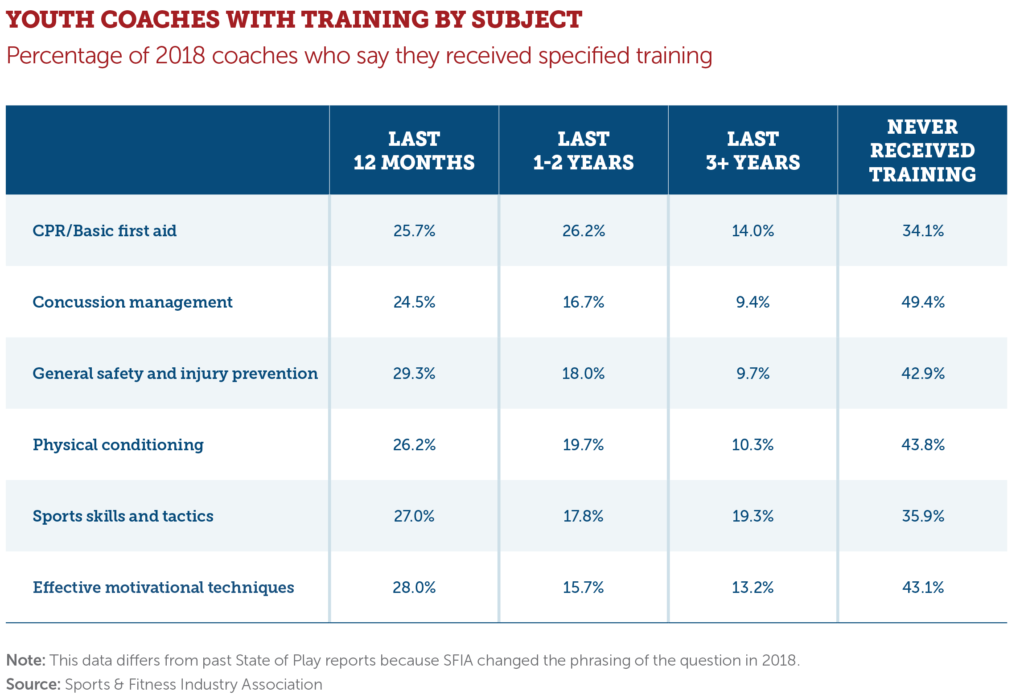
More than four in 10 coaches reported having never received training in concussion management, general safety and injury prevention, physical conditioning, and effective motivational techniques. The latest numbers also make clear that when coaches do get trained, it’s typically not on an annual basis.
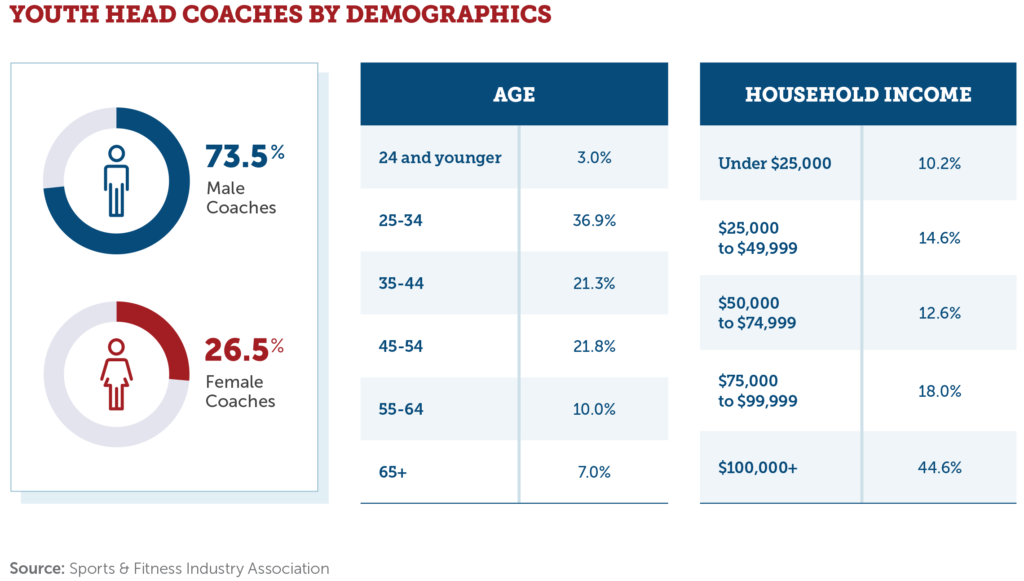
Given how difficult it is to find volunteer coaches, the 2018 numbers continue to show how more coaches can be added. Only 27% of youth coaches were female, up from 23% in 2017 but still very low. There are also very few coaches of high school and college age, and not many senior citizens who coach.
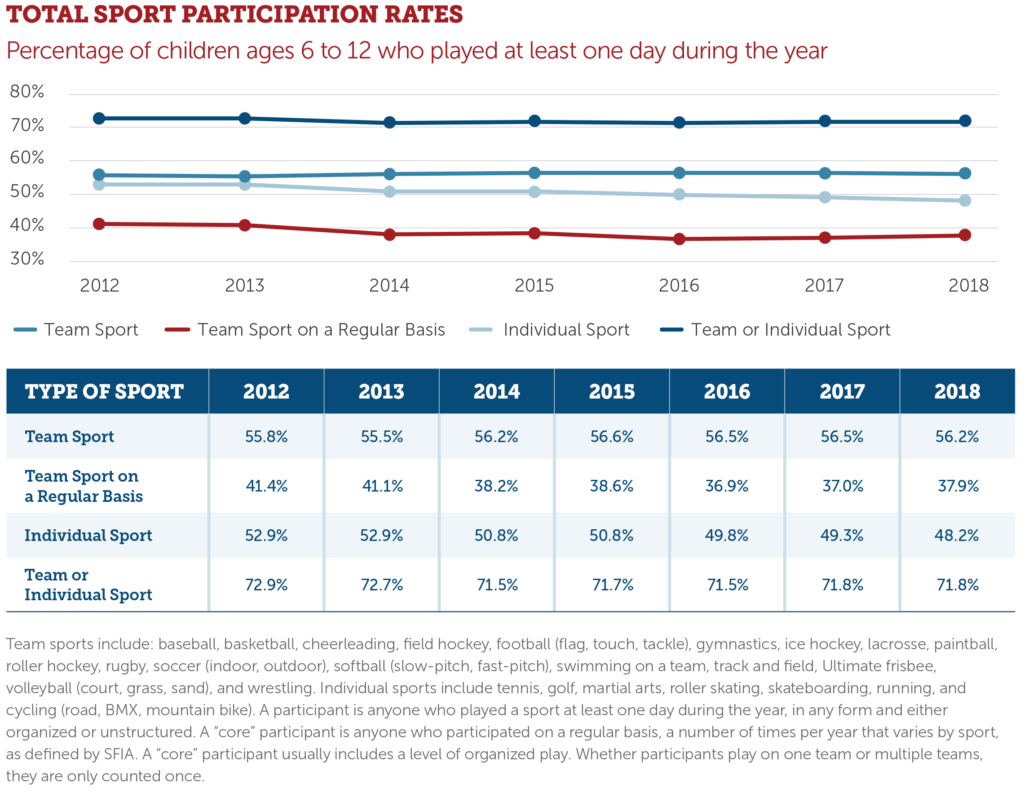
Good news: The percentage of kids who play at least one day during the year has held steady for five straight years since increasing in 2014. Also, the amount of kids playing team sports on a regular basis increased in 2018 by nearly a full percentage point. The bad news: For the third straight year, fewer kids are playing an individual sport.
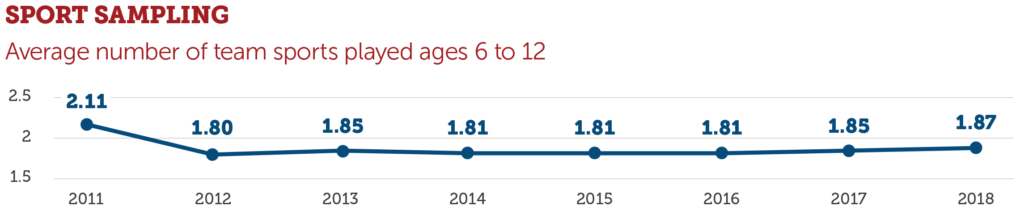
Kids played an average of 1.87 team sports. It’s the second straight year with a slight improvement, though still well below the level of 2011 (2.11). Anecdotally, there are signs that kids are sampling more sports but still playing one sport year-round against the advice of medical experts due to the risk of burnout and overuse injuries.
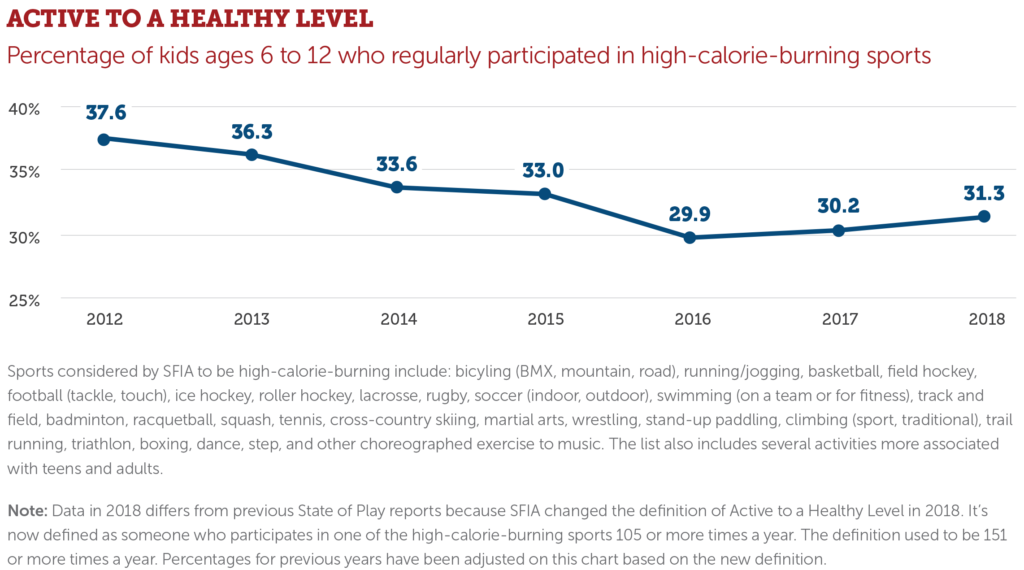
This statistic showed a rare increase in 2018. Important note: SFIA changed this definition in the past year, though percentages for previous years have also been adjusted based on the new definition.
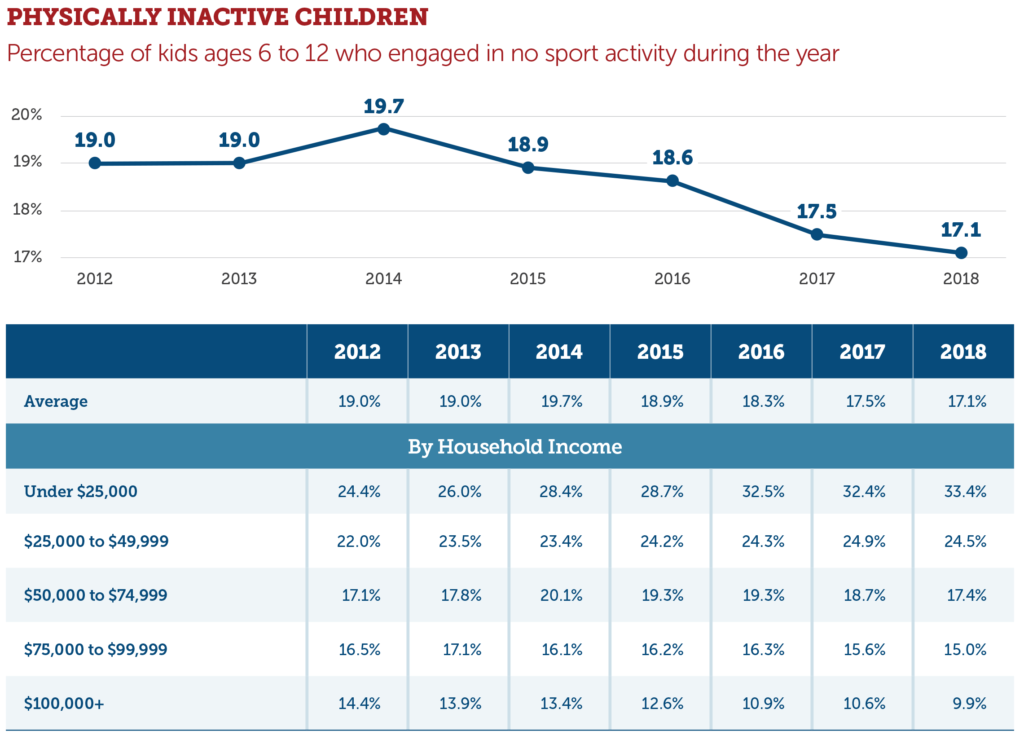
Each year, this continues to be the most positive statistic we track. The percentage of physically inactive children has now decreased for four consecutive years, from 19.7% in 2014 to 17.1% in 2018. That’s still too many children not moving their bodies, but it’s a major advance. Every household income category had fewer inactive children except one: Kids in homes under $25,000, where the inactive rate has gone from 24.4% in 2012 to 33.4% in 2018.
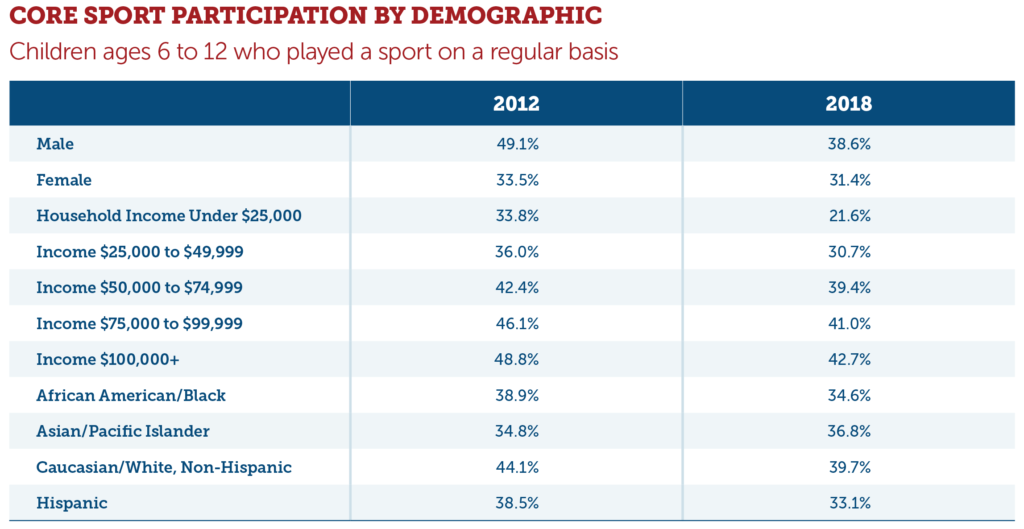
The gap between girls and boys regular participation sports has closed since 2012. But that’s because the percentage of boys dropped significantly in those six years, compared to a modest decline by girls. Kids who identify as Asian/Pacific Islander were the only ethnicity to increase regular sports participation.
To learn more about Project Play, visit www.ProjectPlay.us. Read State of Play 2019 at as.pn/play2019 to learn all 40 developments regarding the latest youth sports trends over the past year. The report is sponsored by Hospital for Special Surgery (HSS).

