The share of U.S. households with negative net worth – meaning that the amount of debt they owe exceeds the value of all the assets they own – jumped above its historical trend during the Great Recession (2007-2009) and never returned to normal. As of 2019, 10.4% of households (about 13 million) had negative net worth. As part of the Aspen Institute Financial Security Program’s ongoing examination of the future of wealth in America, we used the Survey of Consumer Finances (SCF) to explore who has negative net worth and understand why their share of the population has remained above pre-2007 levels. This blog builds upon key findings we shared in our recent report, 101 Solutions for Inclusive Wealth Building, by providing more details about households in net debt and their financial challenges. Our analysis will inform our efforts to identify solutions that could put families in net debt on sustainable pathways for building wealth.
Negative net worth became a big problem after the Great Recession
Despite experiencing the longest economic expansion in modern U.S. history from 2009-2020, households are significantly more likely to have negative net worth today than they were a generation ago.
Despite experiencing the longest economic expansion in modern U.S. history from 2009-2020, households are significantly more likely to have negative net worth today than they were a generation ago. From 1989-2007, the share of households with negative net worth held steady between 7% and 8%. The share began rising after the Great Recession (2007-2009) and peaked in 2013 at 11.6%. By 2019, 10.4% of households (about 13 million) had negative net worth.
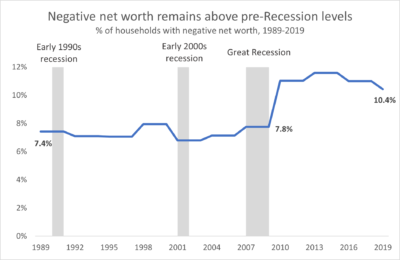
Source: Aspen FSP analysis of Federal Reserve Board, 2019 Survey of Consumer Finances
The rise of negative net worth shows that being on the lower end of the wealth distribution now means having even less than it did in the past, and more people are in that situation. But are those households struggling financially? In the following sections, we show that households with negative net worth are a mix of those who live with chronic financial hardship and those transitioning towards building positive wealth (usually through a mortgage and homeownership). However, the rise of student loan debt makes the future of “transitory” negative net worth less certain, as more households take longer to repay.
Negative net worth is often – but not always – an indicator of financial hardship
As of 2019, households with negative net worth were more likely than the overall population to belong to demographic groups that experience higher rates of financial insecurity. Compared to all households, those with negative net worth were:
- Lower-income, with a median income of $39,707 (compared to the national median income of $59,051).
- Twice as likely to be headed by women (44% vs. 27% for all households) and single mothers (17.8% vs. 8.8% for all households).
- More likely to be Black households (28% vs. 15.6% for all households).
Having negative net worth is also associated with elevated financial risk and vulnerability to financial shocks. In 2019, households with negative net worth were:
- More likely than all households to report they would need to borrow money (15.1% vs. 11%) and postpone payments to cope with a financial emergency (8.3% vs. 4.4%).
- Nearly twice as likely as all households to spend at least 40% of their income repaying debts (13.6% vs. 7.4%).
- Significantly more likely than all households to be behind on debt payments (33.3% vs. 12.3%) and to have had an application for credit denied within the past 5 years (26.7% vs. 10.7%).
Households with negative net worth are also younger than average, with a median age of 34 compared to the national median of 52. This could suggest that negative net worth is a temporary phase people experience as they transition into asset ownership and pay off debt. For example, a recent first-time homebuyer may have more debt than assets because they just took out a low down-payment mortgage. They are in transition from having negative net worth to building wealth.
Still, half of those with negative net worth are 35 or older – well past the age when the financial pressures of new adulthood are to be expected, and only a small percentage of this group has mortgage loans. This suggests that many households are stuck with long-term negative net worth.
While mortgage debt jump-started the rise of negative net worth, student loan debt sustained it
Two kinds of debt have mattered most for the historic rise in the rate of households with negative wealth that has taken place since 2007. First, there was a surge in mortgage debt. From 2007 to 2010, the percentage of households with negative net worth that carried mortgage debt more than doubled, from 14.5% to 34%. This corresponded with a rise in overall negative wealth from 7.8% to 11%. But by 2019, the percentage of negative wealth households with mortgage debt had fallen to 18%.
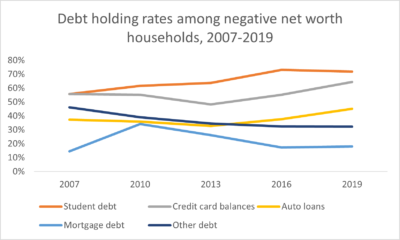
Source: Aspen FSP analysis of Federal Reserve Board, 2019 Survey of Consumer Finances
Following the rise and fall of mortgage debt as a key driver of negative net worth, student loan debt appears to be the primary driver of negative net worth for households today. Between 2007 and 2019, the percentage of US households with negative net worth that had student loan balances grew from 55% to 71%, and the median amount each household owed grew from $21,000 to $38,000.
Between 2007 and 2019, the percentage of US households with negative net worth that had student loan balances grew from 55% to 71%, and the median amount each household owed grew from $21,000 to $38,000.
The rise of student loan debt has also increasingly pushed Black borrowers and families into net debt. While student debt burden increased for all races with negative net worth, by 2019 the percentage of Black households (29%) far overrepresented the share of the overall Black population in the U.S. (16%). This was not the case for any other racial or ethnic group.
Student loan borrowers in net debt may struggle for decades to transition to building wealth
If negative net worth because of student loans is just a transition for those who expect to earn enough to pay off their debt, it might not be a major problem. However, two data points suggest this is not the case:
- In 2019, student debt holders with negative net worth were more likely than those with positive net worth to have only some college education (39.1% vs. 34.3%), suggesting net debt is a risk for those with student loan balances without the wage premium of a degree.
- From 2007 to 2019, student debt also grew the fastest in older age groups with negative net worth (see chart below). Specifically, the prevalence of student debt grew from 75% to 85% in negative net worth households headed by people under 35, 38.5% to 72% in the 35 to 54 group, and 20% to 34.5% in the over 55 age group.
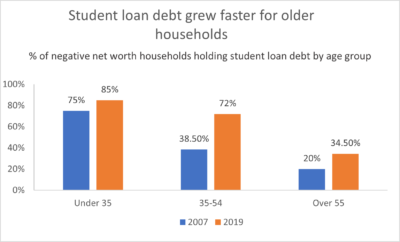
Source: Aspen FSP analysis of Federal Reserve Board, 2019 Survey of Consumer Finances
If these trends are associated with longer repayment times, negative net worth could be a growing long-term risk for student debt holders.
How we can reverse the trend of rising negative net worth
The data suggest that households with negative net worth include those beginning a journey of upward mobility and those who are economically marginalized and stuck in net debt. In recent decades, student loan debt has played an increasing role among these households, making negative net worth a more common, longer-lasting condition, especially for student loan holders who face discrimination and exclusion in their financial lives.
However, it doesn’t have to remain this way. Federal policy leaders could instantly pull millions of households with negative net worth out of the red with student loan cancellation. Other strategies to help build assets and alleviate debts include, but are not limited to:
- Matches on short- and long-term savings,
- Higher wages,
- Enhanced workplace and public benefits,
- Greater access to affordable and inclusive financial products, and
- Reforms to debt collection litigation policies.
These and other opportunities for leaders across the public, private, and philanthropic sectors to help families of color and those in the bottom half of the wealth distribution build the wealth they need to achieve financial security are detailed in our recent report, 101 Solutions for Inclusive Wealth Building.

