Metrics that Matter: Financial Tools for Evaluating CDFI Mergers and Acquisitions
Transcript
Joyce Klein [00:00:00]
Welcome, folks. My name is Joyce Klein. I’m the senior director of the Business Ownership Initiative at the Aspen Institute. I’m delighted to welcome you today to our webinar on Metrics That Matter: Financial Tools for Analyzing CDFI Mergers and Acquisitions. As you’re hopefully expecting in this session, we are going to talk about metrics and an analytic framework that can help CDFIs to estimate the potential financial benefits and costs of a merger or acquisition. Obviously, there may be many reasons why CDFIs might want to consider a merger or an acquisition. Financial motivations are not the only one, but they are an important part of why folks might want to think about a merger and acquisition, or at least a factor that they should consider. That’s what we’re going to focus on today.
For today’s event, I am joined by Brett Simmons. Brett’s a senior advisor to the Business Ownership Initiative, and he’s also the principal of Blue Aster Advising. Brett has been a longtime collaborator with our work at the Business Ownership Initiative. You may also know him, he was the founding CEO of Scaling. This new work was an approach that today’s webinar built off was very much developed by Brett. He’s the financial brains of our operation here at BOI, so he’s going to do most of the presenting today.
In terms of our agenda for today, I’m going to start just in terms of an introduction by sharing the context for this body of work that we’ve launched on Metrics That Matter, and then Brett is going to go deep into our topic for today. He’s going to start by sharing some basic context on mergers and acquisitions. Then he’s going to share the analytic steps and framework, walk you through an example of how to apply it, and then think about how to weigh the probabilities of success when it comes to a merger or acquisition.
Then, at the end, we’re going to take your questions. We’d also really like to hear your thoughts about the potential value of this work and what might be helpful to you and your organizations as you think about some of the questions that we are raising today. As I mentioned, I want to share a little bit about this Metrics That Matter Series, which is a new series of webinars that we have launched at the Business Ownership Initiative. We began it in August with what we’re now calling our foundational webinar on Improving Financial Analysis for CDFI Small Business Lenders. That webinar presented metrics and an approach to financial analysis that we thought could help CDFIs to navigate in the current context that many of you are faced with today.
This is a screenshot of the webinar, and you can see that we have the short link. It’s as.pn/metricsthatmatter, if you want to go back and review the slides. We had suggested that we are going to build off of some of the framework from that in today’s webinar. If you haven’t had a chance to look at it yet, and you want to look at it later, that’s where you can find it.
Just a little bit about how we got to this idea of metrics that matter in this work, it really came out of our work with the Microfinance Impact Collaborative, which is a group of six of the largest CDFI micro-lenders that BOI has been convening for about 15 years or so, and we now meet monthly to discuss issues, trends, challenges, and potential areas for collaboration.
At the top of 2026, we were checking in on the big challenges that NYC members were facing or anticipating for the year, so that we could think about our work together. What we heard in asking them what they were thinking about for the year was interesting because, for many years, a lot of their financial challenges were really focused on their balance sheets, but what we were hearing from them was now that their immediate focus was really on their P&Ls, and obviously their financials are connected, so your P&L is connected to your balance sheet.
We were hearing a lot about rather than being worried about net assets or being worried about where folks were going to raise capital, they were really thinking about revenue generation. They were thinking about expense management. They were thinking about what was going to happen to their financial performance as the cost of capital went up. From hearing those concerns, Brett developed a framework that was really based on how banks and fintech lenders think about their performance, rooted in some key metrics related to their income statement. That framework is captured on the slide. That framework is the one that we went through in our foundational webinar in August.
Brett did an analysis of the last six years of the NYC members’ financials, and we presented that to the collaborative members in April, and they really loved it. They thought it very much captured some of their experiences over the past six years. It gave them some insights into where they were in terms of their financial strength. Some of them have since used it and drawn on the analysis in different ways as they worked through some key decisions or some planning. From that, we decided that we would share the framework with the industry. We did that for the first time at the Small Business Finance Forum in June, and then we did the webinar in August. We really wanted to hear whether people thought it was valuable, and we got a lot of good feedback. That was the first webinar.
Then, as we continue to work through the year, I think, as I’m sure is the case for many of you, we’ve both heard, and we’ve been part of ongoing discussions about whether the structure or the composition of the CDFI industry needs to change, about various ideas and options for industry integration or industry collaboration or consolidation. Our collaborative members have certainly talked about this among themselves. We’ve been part of discussions about this on this topic. We were thinking around the middle of the year about writing our own series of papers to share our thoughts about what we thought might make sense if we’re thinking about how do we really create a dynamic and resilient CDFI sector, and then we decided not to write papers.
What we decided was that we think maybe the most impactful way to help CDFIs in the current moment would not be to write a set of papers, but to create a set of tools, metrics, and approaches to using those metrics that could help CDFIs as they sought to make strategic choices about how to respond or what strategies to apply in the current moment. Where we’ve landed is to draw from that foundational framework that we shared in August to do a series of webinars that look at how to apply those metrics or frameworks built on those metrics to choices or paths that CDFIs are considering. Mergers and acquisitions is the first one, and then this slide shows you the list of topics that we’re planning to cover, hopefully through the first half of 2027.
Then the last thing I’ll share before I turn it over to Brett is that the tools and approaches are also designed so that you can apply them quickly and easily. I think as we’ve worked with the collaborative and done other work over the past couple of years, we’ve learned that you can build more complicated and complex tools and models, but if it takes too much time for CDFIs to gather the data they need or to do the calculations, they may not get used. We are rooted in the framework of metrics we shared in August, in part, because there’s just a few metrics, and they can be generated quite quickly from your financials.
We decided to do webinars rather than tools because we think it’s probably easier for folks that want to try to apply these ideas to just have a set of slides and a recording or a transcript that they can walk through and replicate the analysis or the approach themselves. The final thing I’ll say about the series is that if you do use the content, we would just love to hear your feedback about how you’ve used it, was it easier or hard to use, was it helpful, what didn’t work, because this really is a set of tools that we’re trying to build to help CDFIs and to support their work. With that, I’m going to turn it over to Brett to move us forward.
Brett Simmons [00:09:07]
Thanks, Joyce. As Joyce mentioned, the goal here is really to give you a tool that hopefully you can apply very quickly. That goal today means providing tools to get into what is typically a very complicated transaction, which is mergers and acquisitions, and really pinpoint if it’s worth your time, it’s worth the energy, all the complication that goes into that, and try to get to a decision faster. We’re really going to focus on the rules of thumb behind getting to that, and this would not be the core financial model that you would build to make the case to your board. I think you would need to do some more complicated projecting. You’d probably need to dig into people’s accounts, portfolios, and all sorts of other activities to really pinpoint exactly what the financial outcomes are.
I think that this tool and the way we’re going to walk through it can be applied and revised throughout that process and really serve as a foundation for thinking about the prospects for the merger that you might be interested in or the acquisition. I am going to rely on some of the concepts that were in the last financial analysis presentation. Those were the variables that Joyce showed a couple slides ago. I don’t think that in order to understand the concepts today you’ll need to understand exactly how everything’s calculated, but it will be worth going back and looking at that presentation or at least digging into some of the materials around it when you’re thinking about how to apply this moving forward.
We’re going to start with the money, and I think for some this is a little backwards, but the assumption here is that if you’re actually in the stage where you’re thinking about a merger or acquisition, you’ve already done some work to understand if there’s mission alignment with the organization that you’re talking with or organizations, and that you have a sense of how joining together would expand that mission and access to capital, access to small business loans, mortgages, whatever it is that your products are, that there’s some alignment benefit that expands that access.
I think very quickly that alignment conversation becomes one of is there really a margin benefit from doing this? That’s a question of can I go further with my mission with each dollar that I have available to me as an organization, or potentially can I not go as far because the ratios that we’re going to talk about are not performing as well once the two entities are merged.
There’s a big question here whether mergers work at all, and I think there certainly are mergers that work, but when you look at a lot of the empirical data, only about 20% of mergers actually achieve what they state as their financial targets, so that’s a 80% failure rate, which is really high. In other research, 60% fail to generate any net tangible economic or mission value, and there’s some additional research that shows that nearly 50% of mergers get reversed in some manner, so the acquired company gets restructured or dismantled or sold off because the value that was considered as part of the synergies originally just never comes to fruition.
I think it’s important when you’re thinking about mergers and acquisitions to realize that just statistically speaking, you’re more likely to destroy value than create it. That doesn’t mean that these are not potential important tools to help you expand your mission, but when we do the analysis, we really have to be clear-eyed about the probability of success and let that probability of success really guide how we think about the merger. I think one of the realities of this is that if the probabilities really matter and the probabilities say there’s only a 20% rate of success and people still keep doing mergers, I think it means that a lot of times people are wrong about the synergies that they think that they can achieve and that they underestimate the odds of failure or overestimate the odds of success.
Part of the reason we’re going to focus on expected returns is that it forces the analysis to go back to whether you think there’s a strong probability of success. I joked on LinkedIn that I would have the opportunity to write, “May the odds ever be in your favor,” which is from Hunger Games, if you like sci-fi movies, and I’ve never put it in a presentation, so successfully worked it into this one. We’re really going to focus on the odds, the probabilities, and whether the math of the benefits outweigh the risk.
I want to turn to a real-world lesson, which a lot of CDFIs are probably familiar with because these two banks were very active in the CDFI space. Last year, Comerica and Fifth Third announced that they were going to merge, and there’s a type of analysis that people do with publicly traded companies when they announce a merger where they look backwards and say, “What was the average equity value of this company based on the stock performance leading up to the merger? Once the merger was announced, what happened to the stock? How much did it change? What were the terms of the merger itself? Was there cash being exchanged or trading of shares between the two companies?” They look and see how each of those companies moved relative to that baseline.
What they found when they looked at Comerica and Fifth Third was that Comerica shareholders’ their actual value changed in that period immediately after the announcement, so before the merger has actually occurred, went up $1.4 billion. Fifth Third shareholders actually lost value, so their stock went down after the merger announcement. The stock market was saying, “We think that Fifth Third shareholders are not as well off as they would have been otherwise.” When you combine those 2, you see that the market was implying that there was about $900 million of value being created from the merger. That’s the net of Comerica’s benefit minus Fifth Third’s loss, and that net is basically the synergy that the market is expecting.
The interesting thing, and we’re going to come back to this, is that Comerica shareholders’ value creation here was actually more than the synergy being created from that net number. You can see it’s 154% of that value. What that really means from the market’s perspective was that Comerica was capturing all the value from the merger. The price being paid by Fifth Third was taking all of the synergy from the combination, and Fifth Third was being left with all the risk of all the integration premiums and difficulties that come with that. That’s the market perspective. This is one way to do merger analysis, and it really is going to be a framework for how we think about merger analysis today.
What you do in order to calculate the same stuff on the last slide is start with assessing the baseline, so what is the actual value of the two companies going into the merger? We don’t have public stock markets. We have people’s audits. We can look at CDFIs’ average performance, and we’re going to use some of those same financial analysis ratios that we used in the August presentation to get a sense of what the baseline is. We can then adjust the terms to understand the terms of the transaction.
In the case of Comerica and Fifth Third, they had terms about how many shares Comerica got in exchange for one share of Fifth Third when the merger occurred. We don’t have any of that. There’s no equity trading hands, but we can take the combined baselines and start to weight them based on how the two organizations’ sizes will be as part of the combined entity and think about what happens to those performance ratios once they’re combined. Then finally, we don’t have a market that we can track. There’s no stock market that tells us how much CDFI A is worth versus CDFI B, but we can start to move around those ratios that we calculated with the baseline and the combined terms in order to think about what’s possible in a merger.
Maybe your earned income is going to be better. Is it possible that the OpEx ratio of the two companies will improve once they’re combined? That’s what we’re going to walk through today. We’re going to take this public sector market approach to understanding what thousands and thousands of shareholders think about the performance of a publicly traded merger and try to apply some of that same analysis to two CDFIs.
The steps to the analysis, and you can come back to this slide later. There’s going to be a recording, but at a really high level, the steps are starting with those six variables. That’s really the baseline that we were talking about and combining the two entities. I’ll show you how we’re going to do that. Then we’ll start to make adjustments to those baselines in Step 2. I’m calling them worse and better cases because best and worst makes it sound like you have a clear sense of what could be. Things could be worse and could be better than what you come up with, so they just capture what we know now and what we think is in the realm of possibility.
We’re going to then talk about this idea of philanthropic value capture. I think this is really important and often missed in merger analysis and acquisitions in the CDFI space. It’ll harken back to that same image of Comerica taking 154% of the value from the synergies of the 2 banks merging. In some cases, philanthropy takes more value and more of the synergies than you would expect. Then finally, we’ll look at the probabilities and talk about how to use those to think about intangibles of the transaction between two companies.
When you’re combining the information, you’re going to have at least, I would assume you would have a spreadsheet showing the dollar performance on the ratios that we’re going to go through for both companies and then combining those dollars together and then calculating the ratios. Do not take the ratios and combine them because you’ll just get a simple average from doing that, and that won’t account for the fact that the entities that are likely merging or being acquired are not the same size. Combine the dollars first, do your averaging, and then you’ll start to get the ratios for both the underlying entities and then the combined entity, and it will be automatically weighted by the dollar amount.
I’ve done that for CDFI 1 and 2, and a combined entity that puts those two together. These numbers, I’ve taken lots of different CDFIs and created an amalgamation of two. They’re fairly large in this case, so the numbers that I’ll be talking about and the dollars behind these ratios might be larger than some are used to seeing that I think it makes it a little easier to capture some of the idiosyncrasies of how to approach this. We’re going to go through each of these. These are the same variables that Joyce showed earlier, just calculated for CDFI 1 and 2, and then combined.
You can see that on the total return on portfolio below, CDFI 1 generates a little less of their revenue from their portfolio relative to the total expenses of the organization. CDFI 2 is a little more efficient. Once you account for contributed revenue, CDFI 1 actually has more philanthropic dollars on an annual basis and on average than CDFI 2, and that has helped their performance. We’ll dig into what that means for the merger when we get to that part.
How are we going to estimate changes? We’re going to go through each one of those, so earned revenue, cost of funds, provision, et cetera, and think about what the combined entity would look like for those ratios. We’re going to start with what the combined ratio looks like and adjust from that because it’s already been weighted by dollars, which is an important caveat. You don’t want to just start with dollars. Starting with a combined ratio just makes it easier to make sure you’re adjusting and accounting for weighting appropriately.
In the better case, we’re going to compare the two CDFIs. If one is significantly better at generating revenue from their portfolio, or has a better net margin, we’ll start to ask the question of, can that be replicated as a combined entity? Is it unique to them? Is it not? In the worst case, we’re going to look at the CDFI that struggled in that category relative to the other, and think about whether their struggles would translate to the merged entity or not.
To start with on earned revenue, you can see in the combined baseline for this example, the companies achieve a revenue earning ratio of 15.24%. You can ask questions about the products that they have, whether those can drive additional revenue. It’s important to ask questions here about if CDFI has a lot of funds that are tied to governments, local governments state, federal, sometimes they’ll have interest rate caps that hold their earned revenue down. Would that translate into a combined entity? One maybe charged more prior to the merger and generated more earned revenue. Perhaps can’t charge that same amount when the two are merged, and now are exposed to the same government funders that question those interest rates.
It’s also important to think about if there’s products that maybe one has that the other doesn’t that, once they are combined, they can start to offer that product in a wider footprint. Does that allow them to grow their earned revenue? In this case, I looked at the performance of both organizations, and one was close to 17% earned revenue, while the other was lower, closer to 13. I put a better-case scenario showing a few basis point increase above the combined baseline, and a worse case saying maybe the fact that one of these organizations charge lower interest rates, maybe the combined entity will actually bring its interest rate schedule down, so we would anticipate that earned revenue actually gets worse.
From there, we looked at cost of funds. I think that this is one of the most misunderstood parts of the CDFI merger and acquisition conversation. I think a lot of times when people combine balance sheets, it actually means that they are maxing out some of the available low-cost capital. It’s important in this step to think about whether the organizations maybe already work with a lot of regional banks in their footprint, and when they’re combined, does that regional bank say, “I now have too much exposure to a single entity, and I want to actually cut my total debt”? Then they have to go out to the market, find new debt at higher interest rates, or if they’ve already worked with many of those banks, most banks don’t give out low-cost capital just because they’re mission-oriented. It’s because they have CRA obligations.
If they’re already meeting their CRA performance and don’t feel like they need to expand their total debt, it could be that sources of low-cost capital have actually dried up. What I’ve seen in these analyses is that these low costs of funds, like the 1.84%, you’re not going to improve on that in a merged entity, and if anything, it will get worse because of combining different debt holders and maxing out the available CRA capital. In the worst case here, I’ve modeled the cost of funds going up 200 basis points.
The net margin in this case, the combined entity without any of these adjustments, is the 13.4%. The better case, we’re showing some additional upside to 14.4, and then worst case we’re actually compressing the net margin because the earned revenue percentage comes down some, and we’re forecasting an increase in cost of funds. From there, we look at provision rate. When two entities merge, my assumption is that they really have already baked in the risk of their portfolios, so they’ve already been originated. Maybe one is better at servicing and dealing with delinquency, so you could model out some improvement in the provision rate relative to existing portfolio.
If one has a really messy portfolio and you realize that in the M&A process, then you might model that you have to increase your provision rate initially in order to deal with some of that and do a little bit of adjustment to your CISO calculation as a result. I think over time you could really take the lender of the two that has better performance and assume that those practices will be adopted from a risk perspective, and hopefully you would trend towards the better case. If they have a tighter credit box and therefore do fewer loans, you would have to take into account that difference in the earned revenue as well. Perhaps the one that takes higher risk also has higher interest rates, so you could think about the implications of that when you’re trying to adjust these.
Again, the point here isn’t to get into every detail, it’s to think at high levels about the movements and comparative advantages of both organizations, and to just make adjustments from this combined baseline to get a sense of what’s possible. With this combination, you can then calculate the risk-adjusted net margin. The risk-adjusted net margin is the earned revenue minus cost of funds that gets you a net margin. We then subtract that provision rate, and that’s the risk-adjusted net margin. In this case, we’re showing the combined entity without any adjustments at the 9.14. We’re saying that, with some additional portfolio management benefit, that the net margin here is still a little higher in the better case.
Then, in the worst case, if there’s compression on the earned revenue, cost of funds goes up, and there’s difficulties in the portfolio to deal with, so a higher provision rate potentially, and working through that, and all the implications that come with the focus drifting towards dealing with the messy portfolio that could have some opportunity cost for the rest of the portfolio that we’re all actually showing a worst-case outcome as a result.
From here, we start to think about the OpEx ratio. I think this is the area where people get most excited about the potential for mergers and acquisitions, that the combined entities could potentially be more efficient. Remember, the OpEx is just total expenses minus the two costs that we’ve already dealt with, which were the cost of funds and the provision expense. Everything else remaining, the cost of lending, cost of servicing, cost of fundraising, all of that is combined into this calculation. I think the area that people tend to focus on when they’re just trying to get a sense of what’s possible is really personnel and technology. Are there duplications in people that you potentially could reallocate into another department? Is your technology spend going to go down?
I think there’s less fixed cost in the technology spend than there used to be because so much of what we spend now is subscription-based, user-based, so it’s tied to the volume of transactions. There’s a little less benefit in the technology combination, but there still should be some savings there. In this case, I looked at the OpEx ratio of the two combined entities and said, if one of these lenders is much more efficient at getting dollars out the door, so has a lower OpEx ratio, they should be able to take some of those best practices and use them in the combined entity and pull down that combined baseline towards the more efficient organization over time.
Then, in the worst case, you would say, potentially, the organization that was much less efficient as we merge those cultures together, and the difficulty of doing that, we don’t actually retain all the benefits that we expected from the more efficient organization. Some of our processes get muddled, we actually lose some of the performance. In the worst case, I put the OpEx ratio much closer to the worst-performing CDFI’s ratio. I think it’s important to talk about here as well that these ratios turn into real dollars at the end of the day. This 1.4% better case, when compared to that combined baseline, when I just do a back-of-the-envelope look at what that actually means for organizations, in this case, it would be enough to eliminate $250,000 of technology spend, but even that remaining amount is the equivalent of about 20 FTEs.
I think that sometimes that’s lost in these conversations, that a lot of the efficiency gains, if one organization is at 17% OpEx ratio and the other is at 25%, the one at 17% needs much fewer people to get loans out the door. If you ever want to get close to that 17%, then you have to adjust the entire personnel footprint of the organizations, and that does mean that you would potentially need to cut staff in order to realize those benefits, and so those dollars really do represent real jobs and staff at the end of the day, and that’s an important part of thinking about the probability of success. If you have to lay off people or go through that, that’s a big cultural change. It’s a big drag on people’s morale for obvious reasons, and that could limit the potential for success.
The total portfolio return takes that risk-adjusted net margin and just subtracts from it the OpEx ratio. In this case, we’ve taken the combined entity that’s 11.28%. In the better case, because of the efficiency gains, we see that the structural deficit, if you will, of the combined entity is now -8.26. In the worst case, because we’re showing that the OpEx doesn’t actually improve relative to the combined entity, and we already had some of the drag from cost of funds and loss of earned revenue, that now we’re actually in a much more negative position than we were at the start.
When it comes to philanthropic subsidy, this is an area where there’s not a great rule of thumb. It’s much harder to step back and say, “At a high level, my products are like this, my interest rate schedule is like this, my provision rate and losses over the last five years look like this.” You can’t just take that and say, “Here’s what fundraising is going to be in a combined entity.” The reality is that pretty much every CDFI I know, even the ones that generate a lot of income off their portfolio, rely on philanthropy to cover the gap and to invest in new programs and new products that they want to offer.
I don’t think there’s a great way to do this part of the analysis without actually digging into the specifics of who’s giving to each organization. You can do like a rule-of-thumb application of potential outcomes with contractions or expansion of contributed revenue and get a sense of what’s possible, but if you really want to dig in and understand it, you’ll need to go line by line.
When you do that, one way that we’ve used in the past is to re-categorize the donors based on these four buckets. The first is public. This would be like a federal CDFI Fund award. Two entities merge, they don’t get two CDFI Fund awards. They don’t get double what they would have before. They actually just cut in half what’s possible. If both historically got CDFI Fund awards, as a combined entity, they’re going to get one CDFI Fund award, so as you adjust the averages, you need to basically cut those in half.
The alternative are public volume-based. This would be like the SBA TA grant. As long as you haven’t met the program cap, the SBA TA grant grows with the total volume of product that you’re doing. If someone’s really reliant on SBA TA, or they get funds from the SSBCI programs, those are volume-based. If you do more, you get more. Those can continue to grow in a combined entity, and you wouldn’t expect a contraction. Then you have private donors where there’s no duplication. They were a donor of one but not the other, and in a combined entity, you would hope that donor sticks with the combined entity.
Then, finally, there’s donor duplication. Generally, I don’t assume in doing these analyses that, like, if Wells Fargo gave money to CDFI 1 and to CDFI 2, and they gave $50,000 to each, that they’re going to give 100,000 to the combined entity. Maybe they would, and you can apply a different haircut to it. You could say one got 50, the other got 50. We’re not going to say they get 100. We’re going to say they get 75,000. We’ve just created, in different spreadsheets, a way to manipulate that number once we’ve re-categorized all of those contributors to understand who’s duplicating and who’s not.
In this case, when I went through and thought about these organizations in my example, I was really thinking about organizations that share a lot of donors. I think in that case, you could model out a reduction in contributed revenue anywhere from 10% to 25% would not be unexpected, where the philanthropic partners say, “We’re not going to meet the growth of the two together. We’re just going to stick at whatever our highest was for one or the other.”
What this really means is that any of the operating expense benefit, the cost of funds benefit, earned revenue going up, if you model all those out and let’s say there was $5 million of benefit from the two organizations merging, but you anticipate losing $5 million of philanthropic support, I think of that as philanthropy capturing all of the synergy. You have $5 million of synergy that you could have gotten from all those other variables, but you expect $5 million less of philanthropy as a result of the merger.
Now, this is an opportunity potentially to go back to those philanthropic partners and say, “We want to reinvest these savings into our organization and not have lower philanthropic support, and we want you to grow with us as an organization,” and maybe some of them will come around to that. This is a really important concept of philanthropic capture, and I think in nonprofits, this capture can be quite large. In this model, with the 24% reduction, with all the better case benefits that we talked about, it actually results in 90% of the upside going to philanthropic partners that cut their giving as a result of the merger.
When we look at these together, the combined entity, the total return on all activities is 3.3. In a better case, because of some of the cut in philanthropy, we anticipate 3.59%. In the worst case, these organizations after combination even with that contributed revenue, would actually be resulting in a deficit because of all the challenges that we’ve played into the numbers.
This final part is that the mergers and acquisitions aren’t free. They take legal counsel, they take board time, they take a lot of time from the leadership of organizations. If you have to lay off staff, there’s severance costs, additional audit expense in the first several years. There’s other transition costs as you’re exiting vendors. All of that also just results in friction for the organization. What I’ve done, just as a rule of thumb, is try to think of different levels of complexity and think of them as percentages relative to the combined operating expense of the two organizations.
In a low-complexity, you don’t have offices to combine, you’re using the same technology, you’re not going to get rid of many staff. This cost might be 1%. In a typical consolidation in terms of level of complexity, so some staff loss, combining technology, different systems, put that at 2%. Then, if there’s major office closures, relocation of the headquarters, management team changes, I would expect that to be 3% or even higher. Generally speaking, I wouldn’t assume this number to be less than $500,000 for any merger of similar-sized organizations or even for an acquisition of a smaller partner. There’s just a lot of hidden friction costs that go with this.
Even organizations I’ve talked to that have taken on very small partners as part of an acquisition have said that the ongoing challenges of dealing with legal expense and offices, and they decided a structure for how to incorporate the other nonprofit, and ended up doing it in a way that created additional complication down the road. There’s just ongoing friction costs. This accounts for not only that direct expense, but some of the friction and indirect expense that you would expect from your management team just having to deal with the complexities of the merger and not the day-to-day work.
What does it mean when we put all this together? The cost estimate for these two CDFIs that I have used is that their cost to merge would be about $5 million. That’s direct expense plus indirect friction cost. What I want to find is whether the expected return from the merger is better than that cost. Now, you might say that cost isn’t repeating every year. This is true. I could set this to zero and say, do we at least achieve break-even as a result of the expected returns here? You could hate that approach, but I think that if you’re really going to pursue mergers and acquisitions where it really makes sense for your organization, setting the bar to at least achieve the expenses that you would expect means that you’re really only going to focus on those that would provide the best value for you as an organization.
To do this, we just take those same odds that we started with. We say there’s 80% odds that you’re actually going to lose $21 million a year, which is large, but again, these are 2 very large organizations to start with. In the better case, there would be 20% odds, so 1 in 5, that you gain 9.5 million. The expected outcome from this is -15 million, which is less than the target benefit that we want to see of at least 5 million, because that’s what the cost estimate is. I can flip these. I can say, well, let’s assume the worst case is only going to happen 10% of the time, and that the better case is 90%. In that case, yes, the expected outcome here is now that we would be better than the target of $5 million.
The question for the intangibles is, can we assume better odds than what normally occurs, or should we assume just the 80/20 that’s a typical outcome for a merger? The standard failure odds on the left is the -$15 million expected net value. In the optimistic odds, we flip that, 10% failure, 90% success. You can start to think through this in terms of do we have good culture alignment? Do our leadership teams work together well? Do our boards know each other? Do the boards have experience with mergers? Do we have similar systems? When you start to think through the more intangible aspects of this, you might say to yourself, “Given what we know about these 2 organizations, I think we have a better probability of success than the 80/20, so maybe we’re going to say 40/60 or 30/70.”
You can use that to start to play with, “How confident do I need to be, and how high of a probability of success do I need to have for this to actually pan out in terms of the benefit?” If you were having to put the probability of success at 90% to make the case that the numbers would bear out and there would be positive synergies, it’s probably not a merger worth pursuing, because the odds are that you’re not going to be successful 90% of the time. I would say keeping things close to 20/80, maybe 30/70 or 40/60 at the most extreme, would be the only adjustments I would make, because at the end of the day, mergers are still really difficult.
If you’re going to pursue a merger, you don’t want to be thinking that everything has to go perfect for it to work out. You really want to deal with the downside scenarios and have a really strong upside scenario that’s worth pursuing because if that upside scenario is not really strong, then odds are you’re going to lock in a much worse outcome, and it’s not worth the time and energy to dig into. Those are ways that you can adjust the numbers.
How would you use this moving forward? Again, once you have that baseline, you can start playing with those ratios and say, “All right, if I adjust the cost of funds and we’re really successful with locking in low-cost capital, even with our larger balance sheet, does that actually move the needle for the combined entity’s outcomes?” I would guess it probably doesn’t, because cost of funds is not a core driver for most organizations in the grand scheme of their income statement. Maybe you look at the OpEx and say, “You know, we actually think that we can really achieve that.” You can start to understand exactly how much savings you need to achieve in order to have that positive outcome from an expected return perspective.
You can iterate through this very easily once you get everything into that spreadsheet. You don’t need a giant financial model. You don’t need to spend hours and hours digging into someone’s portfolio. You can just say, “How many percentage or how many basis points would I need to adjust my earned revenue or my provision expense in order for this to be worth it?” That’s ultimately what you’re trying to think through. Is this something that’s worth doing and worth pursuing, and what has to change to make it worth pursuing?
You might say, using the 80/20, this isn’t worth the time right now because the upside is so small that if it happens 20% of the time with that small upside, this just isn’t worth pursuing. If you’re going to spend the time to think about it, you can then spend a little bit more time to say, “Okay, what would have to change to make this worth it in the future?”
You can very quickly say, “You know what? For it to be better, both of us need to be more efficient organizations first. Neither of us are efficient enough. Neither of us has certain best practices that, when adopted, are going to benefit the whole organization. Let’s focus our time back on trying to improve our efficiency on OpEx, and then maybe a merger will make sense down the road.” Take the time when you’re done with that first iteration to really pinpoint what area would need to change to make it worthwhile down the road, and that’s an area for you to focus on, even if the merger and acquisition isn’t something that you’re going to pursue right now.
All right. We’re going to stop there. I think I’m right on time. I went through some things pretty fast, but these slides will be available down the road. In the Q&A panel, Joyce and I both have that up. If you want to put in questions that you have, we can try to address those. Joyce, is there anything you want to add based on hearing me–
Joyce [00:45:37]
Maybe just a couple of things. One, I would just say there was a lot there. One of the reasons we did really want to do this as a set of webinars is so that we will archive the content. It takes us a couple days to get everything wrapped up, but then we will email everyone who registered a wrap-up email that will have a link to the content. It’ll have the recording, it’ll have the slides, and it will have a transcript. I actually like transcripts because then I can just go back to, like, “Here’s the part I was stuck on,” and read it quickly. I don’t have to listen to the whole recording again. That will be coming for folks.
The other thing I would just love is, if anyone has any questions, if anyone has any feedback on what felt helpful about today, [laughs] what felt less helpful about today, how should we approach future webinars in the series, we’d also be really interested to hear that. You can share that in the chat, or you can share it in the questions.
Brett [00:46:48]
One question-
Joyce [00:46:52]
I see you see it. Go for it.
Brett [00:46:54]
-is whether this analysis would change whether it’s a merger or an acquisition. I think, conceptually, it would be the same approach. I think oftentimes when people say merger, they tend to think of organizations that are more similarly sized in an acquisition. Perhaps it’s a smaller organization being taken over by a larger organization. In either case, you can use the same analysis. Maybe the acquisition is happening in part because the smaller organization is much more efficient than the large, and they want to adopt practices that the smaller has, or maybe the smaller organization is very good at fundraising, but they struggle with getting loans out the door, so there’s an opportunity to tap into that local donor base through the acquisition.
Again, you can use that same analysis to highlight those changes. It’s just when one organization is much larger than the other, it’ll tend to wash out some of the differences, so it’ll be a little harder to see how the small organization is impacting the whole combined entity, but it would highlight the same types of changes for you to consider.
One of the questions that I’ve gotten in doing this work for several CDFIs at this point is what to do about the philanthropic changes that you anticipate as a result of the conversation. I think there have been some philanthropic supporters that say they want to see more organizations merge. There’s been funding from Sorenson Impact Group and others trying to encourage people to think about partnerships, consolidation. I think that’s all well and good, as long as that support for the merger is not just a one-time thing. If it’s one-time support, the way that I’ve considered it is to reduce that cost of the merger.
In this case, we said $5 million. If someone comes in with one-time support of $3 million to support the work on the merger, then I would target only needing to achieve $2 million in benefit when I do the expected return. Because it’s just one time, though, you still have to take into consideration that you might lose some of those philanthropic supporters on a year-to-year basis, so the same analysis would apply in that case. It just is going to change what you’re targeting for your outcome. Joyce, are there other questions to think about?
Joyce [00:49:21]
I don’t see anything. We’ve got a few people sharing some nice feedback, thank you, in the chat, but I don’t see any other– Oh, wait, we’ve got one more question. More comments. Just more feedback about having more case examples of how CDFIs have applied the framework and how those things have come up for them. Thank you. We have, just to say, if folks do think about using this and want to share that, it’s great. I will say, Brett, I don’t know if there’s anything else you want to share. One of the things is you have used this framework for some organizations that have considered mergers and acquisitions. One of the challenging things about this particular strategy is people often don’t talk about those things publicly. [laughs]
Brett [00:50:14]
Yes.
Joyce [00:50:15]
It’s a little hard in some cases to share. You shared a little bit about how people have thought about or questions that have come up about the analysis around philanthropic subsidy, but any other issues that have come up as you’ve worked through this in a case example?
Brett [00:50:33]
I think two things. One, one of the needs we’re trying to address is that I don’t think there’s a helpful framework right now to do this analysis. Then what we’re trying to provide is a way to have a conversation with the merger partner in a much simpler and faster process than roundabout conversations about you can really dig in very quickly to say, “Is this worth our time? What are we bringing to the table? What’s possible?” In some sense, this hasn’t been applied in a broad sense because it hasn’t existed in the way we’re talking about today. I think a lot of the merger and acquisition conversation among CDFIs is fairly new and in the last five years has become a bigger topic, so applying this will hopefully become something useful for people, and we’ll have more examples over time.
In the cases where I’ve applied it, I think what’s been really interesting is organizations that overlap in product type or overlap in geography tend to require much more extreme cutting because they tend to lose more philanthropic support in the analysis, because they’re in the same geography where they already have supporters supporting them for a particular type of product, and the types of CDFI supporters out there tend to be the same for certain product types. You have all this overlap, and so they end up losing a fair amount of philanthropic support in the analysis. In order to achieve a positive outcome, they really have to think about the efficiencies on the OpEx side.
In some cases, that really has required thinking about cutting 20, 30 staff. I think when CDFIs start to deal with the challenge of cutting staff, it becomes much harder to make the case that it’s going to be an easy merger. Cutting staff is really hard. It’s really difficult. Even if you know that it’s going to help your mission go further in the long run, it can really weigh down an organization for multiple years as they deal with coming out of that morass that comes from just being in that environment. A couple of instances where mergers were called off because of just the challenges they saw in having to deal with that. Again, I see that more in shared geography, shared product set, making it a little more difficult.
Joyce [00:53:00]
The other thing that I think just might be worth thinking about a little bit, and this is less about proving out the application of the framework and something to think about, but if you are looking for efficiencies on the OpEx side, I think there’s an interesting conversation right now about whether product proliferation is a good thing or a bad thing for CDFIs. We’ve talked with a lot of CDFIs recently that are thinking about narrowing down their products because they feel like they’ve taken on a level of organizational complexity that actually makes them less efficient as organizations, so I do think this question about really thinking through if you’re merging to add products, where are you really, and how are you really going to see improvements in your OpEx is an interesting question.
Brett [00:54:00]
Yes. We are going to do a webinar on managing products and complexity, so if you’re interested in that topic, we’ll definitely dig into it more. I see a question here about leverage. If one CDFI is under-leveraged, so I would interpret that as having a really high net asset ratio while the other doesn’t. In that scenario, I would really try to think through whether the cost of funds could actually come down. Most of the time, I don’t model the cost of funds coming down. If one organization is very leveraged, the other isn’t, it presents the opportunity for adding leverage that wouldn’t have been there before. If it feels like there’s leverage that could be added at a low cost of funds, then you would try to think about that through the cost of funds lever. That would be the primary way to think of it, I think. [silence]
Joyce [00:54:56]
Great. All right. I don’t see any more questions, so I think we can-
Brett [00:55:00]
One more question just popped in.
Joyce [00:55:01]
-move to our close. Pardon?
Brett [00:55:03]
One more question that just popped in.
Joyce [00:55:05]
Oh, okay, great.
Brett [00:55:06]
I would say most organizations I’m seeing in terms of self-sufficiency are in the 30% to 70% range. I really try to avoid the self-sufficiency and just think about the total return on portfolio and then the amount of contributed revenue to come up over that gap. I keep seeing cases of people that either have high OpEx ratios, and that’s what’s pulling them down. They haven’t really adopted some of the best practice out there, or organizations that are pricing their loans potentially too low given where interest rates are at, and so their earned revenue is lower than it could be. In both cases, those two things can be dealt with without a merger or acquisition. I would recommend people to consider that as they’re thinking about this first. All right, that was the last one, Joyce. I’ll go to the last slide here.
Joyce [00:55:57]
Great. Just as a reminder, this is the first in a series, or I guess the second in the series. If you’re interested in some of the future topics that we’re going to cover, and again, our hope is to get through these by the middle of next year. We are planning on doing our next one on December 7th, and that’s going to be on innovation. Correct, Brett?
Brett [00:56:21]
It’s on portfolio acquisitions.
Joyce [00:56:23]
Oh, so this isn’t quite in the right order. Sorry. It should be on the website. It’s going to be on how to think about portfolio acquisitions. That’s going to be on December 7th, and we should be announcing that and sending out the link soon. I think if we go to the next slide–
Brett [00:56:42]
That’s the last one.
Joyce [00:56:43]
Oh, this is the last one? All right. In the chat, I think we will share, for my EOP team, if you can throw in the chat. We do have a webpage on our BOI website that can link you to this whole webinar series. If you’re interested in looking at the original webinar that we did, it is already archived there. This webinar will be archived there next week. Thank you. It’s in the chat now for folks. Then that will be also the place where you can register and keep tabs of future webinars. Also, if you received directly an invitation to this webinar, you will receive future ones because it means you’re on our mailing list. We do always announce them multiple times in advance by email as well as promoting them on LinkedIn. Those are the best ways to find out about it.
As always, particularly, you can reach out to Brett and me on LinkedIn if you have any feedback, any more questions. As we say, anyone who starts to dive in and use these, if you have questions about how to use it, please feel free to reach out. If you have feedback about whether it’s worked for you or hasn’t worked for you, please also do share that because we really do want to continue to build and improve the work. Anything else, Brett?
Brett [00:58:06]
I’ll just say, if you go through the process with someone and you’re thinking about a merger or acquisition, decide it doesn’t make sense, a lot of those conversations do become a portfolio acquisition conversation. If someone was interested in being acquired because they’re struggling, maybe you don’t want to take on the whole organization, but they want to move their portfolio to another mission lender. That’s part of what we’ll be thinking about is how do you take on someone else’s portfolio or do a large portfolio acquisition? That’ll be one use case among others in that conversation in December.
Joyce [00:58:40]
All right. Thanks again, everyone, for joining us. We really appreciate it, and send us any feedback. [silence]
Resources & Slides
For more information about the MIC Collaborative, visit this page: https://www.aspeninstitute.org/programs/business-ownership-initiative/microfinance-impact-collaborative/
About this event
How can CDFI leaders determine whether a merger or acquisition is the right strategy for their organization?
In this conversation, the Aspen Institute Economic Opportunities Program’s Business Ownership Initiative explores practical financial tools for evaluating mergers and acquisitions among community development financial institutions (CDFIs). Joyce Klein, senior director of the Business Ownership Initiative, and Brett Simmons, senior advisor, discuss how to estimate potential financial benefits, use key ratios to develop baseline scenarios, and assess the likelihood of a successful transaction.
The discussion considers how financial analysis can help CDFI leaders weigh potential benefits against challenges such as organizational culture and mission alignment, and determine whether to pursue a merger or explore alternative strategies for organizational resilience.
Watch the first event in the series:
https://as.pn/metricsthatmatter
Learn more about the Metrics That Matter series and upcoming webinars:
https://as.pn/metricsthatmatterseries
Explore the Business Ownership Initiative:
https://www.aspeninstitute.org/programs/business-ownership-initiative/
Our speakers include BOI Senior Director Joyce Klein and BOI Senior Advisor Brett Simmons, principal at Blue Aster Advising.
For highlights from this discussion, subscribe to our YouTube channel. Or subscribe to our podcast to listen on the go.
About the Business Ownership Initiative
The Business Ownership Initiative, an initiative of the Economic Opportunities Program, works to build understanding and strengthen the role of business ownership as an economic opportunity strategy.
About the Economic Opportunities Program
The Aspen Institute Economic Opportunities Program advances strategies, policies, and ideas to help low- and moderate-income people thrive in a changing economy.
Join Our Mailing List
To receive occasional emails about our work — including new publications, commentary, events, fellowships, and more — join our mailing list.
Connect on Social Media
For news and updates every day, connect with us on the social media platform of your choice.

Metrics that Matter: Financial Tools for Evaluating CDFI Mergers and Acquisitions

Metrics that Matter: Improving Financial Analysis of CDFI Small Business Lenders

From Crisis to Continuity: Optimizing CDFI Capital and Partnerships for Natural Disaster Response
The New Era of Small Business Finance: Access, AI, and Accountability (Highlight reel)

The Changing Role of Small Business Ownership
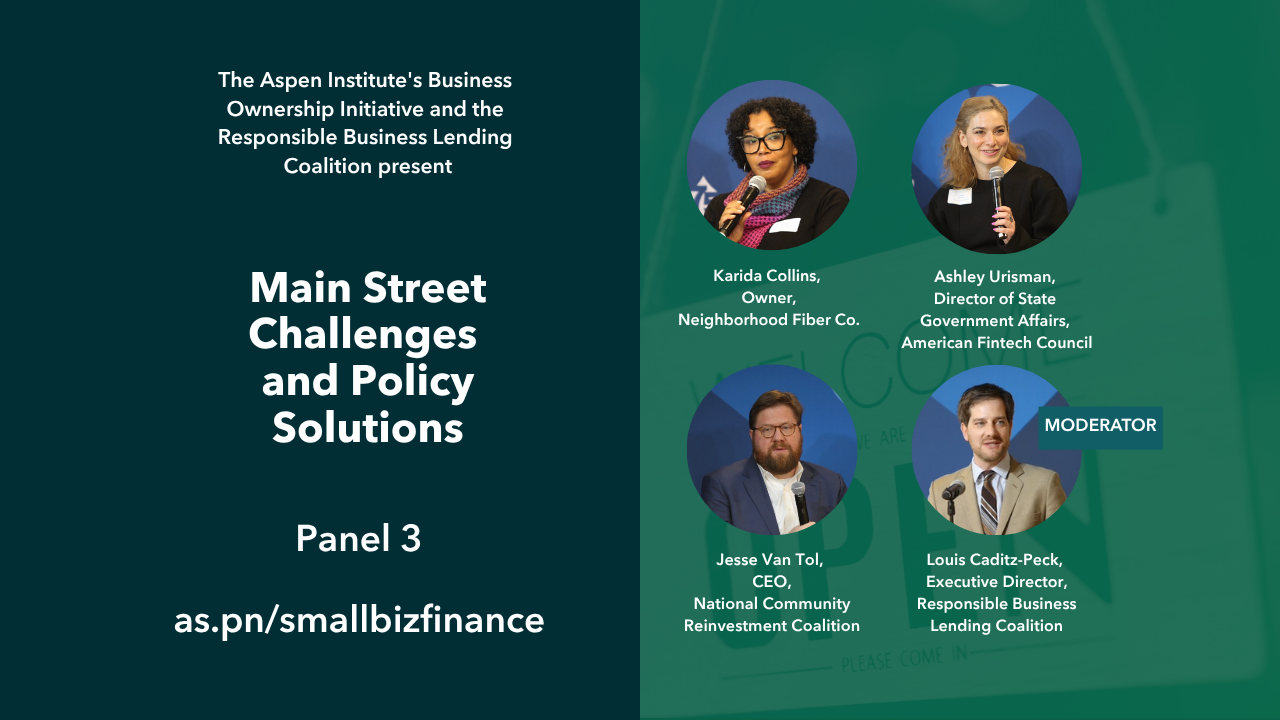
Main Street Challenges and Policy Solutions
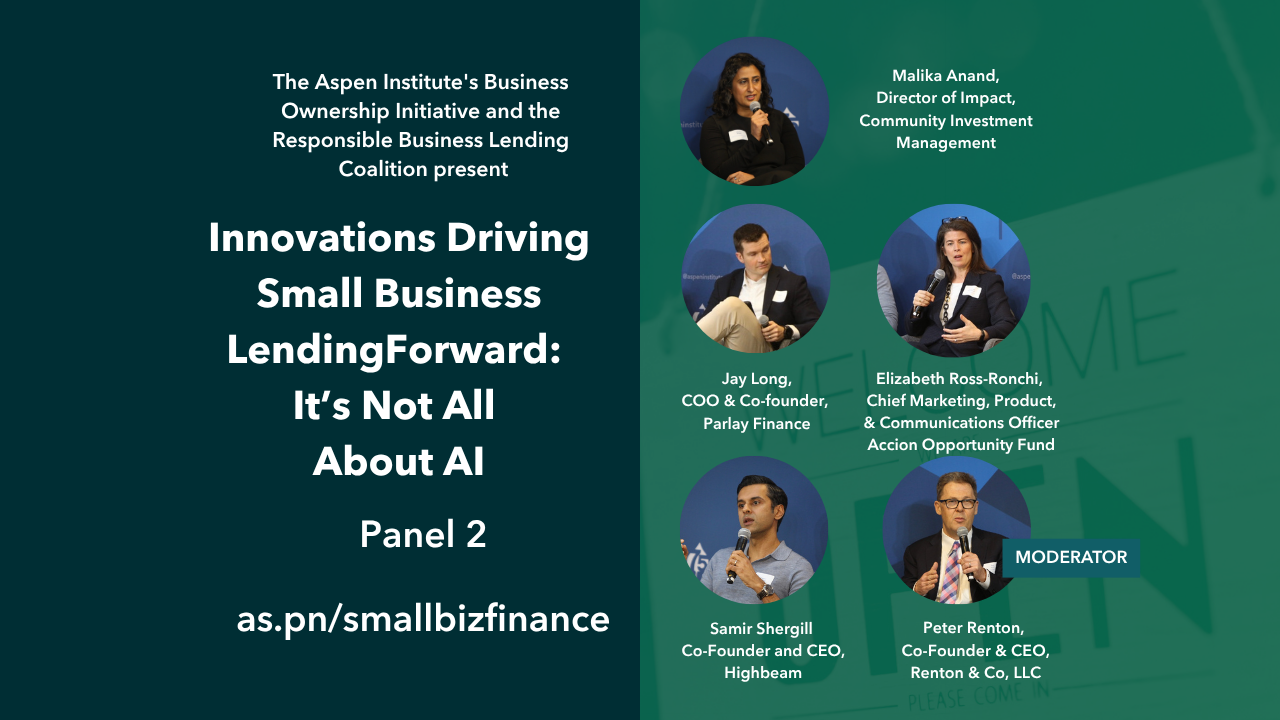
Innovations Driving Small Business Lending Forward: It’s Not All About AI